
Seagrass

Halodule wrightii (Credit: Hans Hillewaert, Creative Commons Attribution-Share Alike 4.0 International license Exit)
Seagrasses have been used by multiple states and territories as an assessment endpoint for nutrient pollution management. The value of seagrasses as an endpoint derives from several key characteristics, including their ecological importance, sensitivity to changes in nutrient pollution, and relevance to waterbody management goals (USEPA 1998). Furthermore, it is easy to measure and communicate their status to the public, who value the many benefits they provide. These characteristics of seagrasses provide a strong basis upon which to use seagrasses as assessment endpoints for numeric nutrient criteria derivation to address nitrogen and phosphorus pollution.
To use them effectively, it is important to understand the role they play in the ecosystem and the nutrient and non-nutrient factors that affect their distribution and health. With this understanding, an environmental manager can gain a better understanding of their status in an estuary or coastal waterbody to derive numeric nutrient criteria to protect designated uses under the Clean Water Act.
What are seagrasses?
Seagrasses are a group of submerged flowering plants that grow in brackish and marine waters. The term submerged aquatic vegetation, or SAV, applies to both seagrasses and similar plants in freshwater. The term seagrass refers to an ecological group and so encompasses a variety of families. Some characteristics of seagrasses include being limited to estuarine or marine environments, having the ability to pollinate and produce seeds underwater, and having rhizomes. Here we intend the discussion of seagrasses to include taxa that prefer high salinity, such as Halophila decipiens, and others that thrive in waters with a larger range of salinity, such as Ruppia maritima.
Seagrasses as Endpoints
Importance of seagrasses
Seagrass communities have many important functions.
- Seagrasses are foundation species, meaning the structure they provide and the ecological functions they perform create and define an entire community or ecosystem (Hughes et al. 2009).
- The related concept of “ecosystem engineers” also applies to seagrasses. Ecosystem engineers modify their physical environment, including the structure and biogeochemistry of sediments and the physical circulation in and around seagrass beds.
- Seagrass meadows also provide many ecosystem services, including protecting coastal areas from erosion, settling suspended sediments from the water, removing nitrogen and phosphorus pollution, removing other contaminants, and sequestering carbon, among many other roles (Nordlund et al. 2016).
These functions support common designated uses such as recreation and aquatic life:
| Function | Support of Designated Uses |
| Food source |
|
| Physical habitat |
|
| Water quality |
|
| Erosion protection |
|
Seagrass as an indicator of ecosystem health and an assessment endpoint

Syringodium filiforme (Credit: James St. John, Creative Commons Attribution 2.0 Generic)
Seagrasses are considered robust ecological indicators of water and sediment quality (Nelson 2009, Sutula et al. 2011, Borja et al. 2012). As such, changes in seagrass habitats can be important signs of ecosystem deterioration (Bricker et al. 2003, Orth et al. 2006). Recognizing this, many organizations use seagrasses as an assessment endpoint to indicate ecosystem health for numeric nutrient criteria derivation, as well as in other regulatory and non-regulatory programs. Because the characteristics that make seagrasses effective assessment endpoints for numeric nutrient criteria derivation also make them useful as assessment endpoints for other nutrient management approaches (e.g., Total Maximum Daily Loads [TMDLs], ecosystem restoration), they are widely used to address nutrient pollution.
- Seagrasses are the primary assessment endpoint used for management of Tampa Bay, where successful management programs have reduced nutrient pollution loads and improved water quality in the Bay (Janicki et al. 1995, Greening et al. 2014). Refer to Tampa Bay Case Study.
- The Puget Sound Partnership uses eelgrass (Zostera marina) area as one of the key vital signs of the Sound—a set of indicators and targets for achieving a healthy Puget Sound ecosystem through restoration and conservation (for information on development of this endpoint refer to Dowty et al. 2010).
- Due to the susceptibility of seagrasses to human disturbances, the European Water Framework Directive considers seagrass an indicator of eutrophication (Ferreira et al. 2011).
- Additionally, seagrass is one of five sensitive assessment endpoints of pollution in the U.S. National Estuarine Eutrophication Assessment (Bricker et al. 1999, 2003, 2007).
- Some states have incorporated seagrasses into their TMDL and criteria programs as assessment endpoints (Table 1). For example, Massachusetts incorporated eelgrass metrics into over 15 TMDLs since 2015 and they play an important role in the multi-state TMDL in Chesapeake Bay. Refer to Massachusetts Embayments Case Study.
- Florida included a seagrass endpoint in the development of numeric nutrient criteria for estuaries in the state. Refer to Florida Estuarine Case Study.
TABLE 1. TMDLs and criteria using seagrasses as endpoints.
| State | TMDL ID | Name of TMDL | Pollutant | Assessment Endpoints | Measure |
| FL | 38207 | TMDL Report: Nutrient and Dissolved Oxygen TMDLs for the Indian River Lagoon and Banana River Lagoon | TN, TP | Seagrasses, DO | Seagrass depth/distribution, DO |
| FL | 51140 | Final Total Maximum Daily Loads for Dissolved Oxygen and Nutrients in McKay Bay (WBID 1584B), Palm River (1536E), and Ybor City Drain (1584A) | TN, TP | Seagrasses/SAV | Chl a concentration |
| FL | 32101 | Nutrient and Dissolved Oxygen TMDLs for the Indian River Lagoon and Banana River Lagoon | TN, TP | DO, maintenance of healthy seagrass ecosystem | DO concentration, Chl a concentration, excessive TN, TP |
| MA | 30337-30343, 30345, 30347-30350 | Stage Harbor, Sulphur Springs, Taylors Pond, Bassing Harbor and Muddy Creek Total Maximum Daily Loads For Total Nitrogen |
TN | Eelgrass, algal blooms, benthic communities, DO | Eelgrass coverage, Chl a concentration, benthic infaunal metrics, bottom water DO concentration |
| MA | 32532, 32534, 32535, 32537, 32638 | Great, Green and Bournes Pond Embayment Systems Total Maximum Daily Loads For Total Nitrogen |
TN | Eelgrass, algal blooms, benthic communities, DO | Eelgrass coverage, Chl a concentration, benthic infaunal metrics, bottom water DO concentration |
| MA | 33780, 33781, 33786-33799 | Pleasant Bay System Total Maximum Daily Loads For Total Nitrogen | TN | Eelgrass, algal blooms, benthic communities, DO | Eelgrass coverage, Chl a concentration, benthic infaunal metrics, bottom water DO concentration |
| MA | 33811-33815 | Quashnet River, Hamblin Pond, Little River, Jehu Pond, and Great River in the Waquoit Bay System Total Maximum Daily Loads For Total Nitrogen |
TN | Eelgrass, algal blooms, benthic communities, DO | Eelgrass coverage, Chl a concentration, benthic infaunal metrics, bottom water DO concentration |
| MA | 33858 | Centerville River – East Bay System Total Maximum Daily Loads For Total Nitrogen |
TN | Eelgrass, algal blooms, benthic communities, DO | Eelgrass coverage, Chl a concentration, benthic infaunal metrics, bottom water DO concentration |
| MA | 33965-33969 | Popponesset Bay Total Maximum Daily Loads For Total Nitrogen | TN | Eelgrass, algal blooms, benthic communities, DO | Eelgrass coverage, Chl a concentration, benthic infaunal metrics, bottom water DO concentration |
| MA | 33988-33993 | Three Bays System Total Maximum Daily Loads For Total Nitrogen | TN | Eelgrass, algal blooms, benthic communities, DO | Eelgrass coverage, Chl a concentration, benthic infaunal metrics, bottom water DO concentration |
| MA | 34009 | Little Pond Embayment System Total Maximum Daily Loads For Total Nitrogen | TN | Eelgrass, algal blooms, benthic communities, DO | Eelgrass coverage, Chl a concentration, benthic infaunal metrics, bottom water DO concentration |
| MA | 34284, 34328, 34331, 34332, 34917, 34918 | West Falmouth Harbor Embayment System Total Maximum Daily Loads For Total Nitrogen |
TN | Eelgrass, algal blooms, benthic communities, DO | Eelgrass coverage, Chl a concentration, benthic infaunal metrics, bottom water DO concentration |
| MA | 34345 | Oyster Pond Embayment System Total Maximum Daily Loads For Total Nitrogen |
TN | Eelgrass, algal blooms, benthic communities, DO | Eelgrass coverage, Chl a concentration, benthic infaunal metrics, bottom water DO concentration |
| MA | 35069 | Phinneys Harbor Embayment System Total Maximum Daily Loads For Total Nitrogen |
TN | Eelgrass, algal blooms, benthic communities, DO | Eelgrass coverage, Chl a concentration, benthic infaunal metrics, bottom water DO concentration |
| MA | 36011, 36012 | Nantucket Harbor Embayment System Total Maximum Daily Loads For Total Nitrogen | TN | Eelgrass, algal blooms, benthic communities, DO | Eelgrass coverage, Chl a concentration, benthic infaunal metrics, bottom water DO concentration |
| MA | 36219-36222, 36228-36231 | Stage Harbor/Oyster Pond, Sulphur Springs/Bucks Creek, Taylors Pond/Mill Creek Total Maximum Daily Load Re-Evaluations for Total Nitrogen | TN | Eelgrass, algal blooms, benthic communities, DO | Eelgrass coverage, Chl a concentration, benthic infaunal metrics, bottom water DO concentration |
| FL | 55260 | Final TMDL Report, Nutrient TMDL for Goat Creek Marine Segment (WBID 3107A) | TN, TP | Seagrass, algal blooms, benthic communities, DO | Chl a concentration |
| FL | – | Dissolved Oxygen and Nutrient TMDLs for Eight Tributary Segments of the Indian River Lagoon | TN, TP, BOD | Seagrass depth limit, DO | – |
| MA | 68003 | Bass River Estuarine System Total Maximum Daily Load For Total Nitrogen | TN | Eelgrass, algal blooms, benthic communities, DO | Eelgrass coverage, Chl a concentration, benthic infaunal metrics, bottom water DO concentration |
| MA | – | Final Wild Harbor Estuarine System Total Maximum Daily Load For Total Nitrogen (CN #397.1) | TN | Eelgrass, algal blooms, benthic communities, DO | Eelgrass coverage, Chl a concentration, benthic infaunal metrics, bottom water DO concentration |
| MA | 67642 | Westport River Estuarine System Total Maximum Daily Loads For Total Nitrogen (CN-375.1) | TN | Eelgrass, algal blooms, benthic communities, DO | Eelgrass coverage, Chl a concentration, benthic infaunal metrics, bottom water DO concentration |
| MA | – | Final Tisbury Great Pond Black Point Pond Estuarine System Total Maximum Daily Load For Total Nitrogen (CN 398.1) |
TN | Eelgrass, algal blooms, benthic communities, DO | Eelgrass coverage, Chl a concentration, benthic infaunal metrics, bottom water DO concentration |
| MA | 68001 | Swan Pond River Estuarine System Total Maximum Daily Load For Total Nitrogen CN 393.1 | TN | Eelgrass, algal blooms, benthic communities, DO | Eelgrass coverage, Chl a concentration, benthic infaunal metrics, bottom water DO concentration |
| MA | – | DRAFT Slocums and Little Rivers Embayment System Total Maximum Daily Loads For Total Nitrogen (CN 315.0) |
TN | Eelgrass, algal blooms, benthic communities, DO | Eelgrass coverage, Chl a concentration, benthic infaunal metrics, bottom water DO concentration |
| MA | – | Final Quissett Harbor Embayment System Total Maximum Daily Load For Total Nitrogen (CN 374.1) | TN | Eelgrass, algal blooms, benthic communities, DO | Eelgrass coverage, Chl a concentration, benthic infaunal metrics, bottom water DO concentration |
| MA | 68361 | Parkers River Embayment System Total Maximum Daily Loads For Total Nitrogen (CN 335.1) | TN | Eelgrass, algal blooms, benthic communities, DO | Eelgrass coverage, Chl a concentration, benthic infaunal metrics, bottom water DO concentration |
| MA | 64146 | FINAL Lewis Bay System and Halls Creek Total Maximum Daily Loads For Total Nitrogen (Report # 96-TMDL-18 Control #314) | TN | Eelgrass, algal blooms, benthic communities, DO | Eelgrass coverage, Chl a concentration, benthic infaunal metrics, bottom water DO concentration |
| MA | – | Final Lake Tashmoo Estuarine System Total Maximum Daily Load For Total Nitrogen (CN 353.1) | TN | Eelgrass, algal blooms, benthic communities, DO | Eelgrass coverage, Chl a concentration, benthic infaunal metrics, bottom water DO concentration |
| MA | 64583 | Final Lagoon Pond Estuarine System Total Maximum Daily Loads For Total Nitrogen (CN- 390.1) | TN | Eelgrass, algal blooms, benthic communities, DO | Eelgrass coverage, Chl a concentration, benthic infaunal metrics, bottom water DO concentration |
| MA | – | FINAL Herring River Estuarine System Total Maximum Daily Load For Total Nitrogen CN 395.1 | TN | Eelgrass, algal blooms, benthic communities, DO | Eelgrass coverage, Chl a concentration, benthic infaunal metrics, bottom water DO concentration |
| MA | – | Final Fiddlers Cove and Rands Harbor Embayment Systems Total Maximum Daily Loads for Total Nitrogen (Control # 394.1) | TN | Eelgrass, algal blooms, benthic communities, DO | Eelgrass coverage, Chl a concentration, benthic infaunal metrics, bottom water DO concentration |
| MA | – | Final Farm Pond Estuarine System Total Maximum Daily Load For Total Nitrogen (CN – 391.1) | TN | Eelgrass, algal blooms, benthic communities, DO | Eelgrass coverage, Chl a concentration, benthic infaunal metrics, bottom water DO concentration |
| MA | 64380 | FINAL Edgartown Great Pond System Total Maximum Daily Loads For Total Nitrogen (Report # 97-TMDL-3 Control #318) |
TN | Eelgrass, algal blooms, benthic communities, DO | Eelgrass coverage, Chl a concentration, benthic infaunal metrics, bottom water DO concentration |
| MA | 64482 | Final Madaket Harbor and Long Pond Estuarine System Total Maximum Daily Loads For Total Nitrogen (CN – 283.0) | TN | Eelgrass, algal blooms, benthic communities, DO | Eelgrass coverage, Chl a concentration, benthic infaunal metrics, bottom water DO concentration |
| MA | – | Final Sengekontacket Pond Estuarine System Total Maximum Daily Loads For Total Nitrogen (CN-310.1) | TN | Eelgrass, algal blooms, benthic communities, DO | Eelgrass coverage, Chl a concentration, benthic infaunal metrics, bottom water DO concentration |
| FL | – | FINAL TMDL Report Nutrient TMDL for the Caloosahatchee Estuary (WBIDs 3240A, 3240B, and 3240C) | TN | Seagrasses/SAV/DO | DO/Chl a concentration |
| FL | 35988 | Final TMDL Report Nutrient and Dissolved Oxygen TMDL for the St. Lucie Basin | TN, TP | Seagrasses/SAV/DO | DO/Chl a concentration |
| FL | 57680 | Final REPORT Nutrient TMDLs North Escambia Bay (WBID 548AA) Judges Bayou (WBID 493B) Bayou Chico (WBIDs 846C and 846) Dissolved Oxygen TMDL Judges Bayou (WBID 493A) | TN, TP | Seagrasses/SAV/DO | DO/Chl a concentration |
Selecting an assessment endpoint is an important early step in taking a risk management-based approach to the numeric nutrient criteria derivation process (USEPA 1998). When selecting an assessment endpoint, some key factors that support using seagrasses include:
- Ecological relevance: Relevant endpoints often help sustain the natural structure, function, and biodiversity of an ecosystem or its components. Healthy seagrass meadows provide habitat, sediment stabilization, and food, as well as other factors (Refer to “Importance of seagrasses”).
- Susceptibility to stressors: The relationship between nutrients and seagrasses, both direct and indirect, is well documented (Batiuk et al. 1992, Janicki et al. 1995, Hemminga and Duarte 2000, Hauxwell et al. 2003, Larkum et al. 2006, Burkholder et al. 2007, Latimer and Rego 2010). Seagrasses are sensitive to nutrient pollution, but also can withstand periodic nutrient exposures to high nutrient concentrations. As a result, the condition of seagrasses reflects their integrated exposure to nutrient pollution, sometimes over multi-year periods (Orth 2006). Because seagrasses can live for many years and integrate nutrients over periods of weeks to months, the condition of seagrass beds and tissues is reflective of long-term nutrient conditions and waterbody health (Refer to “Factors That Affect Seagrass Distribution and Growth”).
- Relevance to management goals: Because seagrasses support many aspects of the estuarine and aquatic environment valued by humans, they are central to management goals. These management goals are often expressed through common Clean Water Act designated uses, like aquatic life and recreational use support (Refer to “Importance of seagrasses” ).
- When selecting an ecological feature as an endpoint, it is also important for it to be measurable with enough accuracy to support project goals. The status of seagrasses can be assessed and tracked through time, principally via aerial photography and subsequent photo-delineation to generate maps of seagrass coverage. Coverage layers can be analyzed with bathymetric data to provide information about depth of colonization (Beck et al. 2017). These modes of measurement have additional value because they are easily communicated to the public (Refer to “Measuring Seagrass Change”).
- Data are widely available. Remote sensing data for light attenuation and seagrass distribution are often freely accessible online and peer reviewed methods to use them have been developed. Universities, non-profit organizations, and state water quality agencies monitor water quality and seagrass status in many places. State departments of transportation can also be sources of information, especially for historic seagrass distribution.
Factors That Affect Seagrass Distribution and Growth
When using seagrasses as an endpoint to develop numeric nutrient criteria, the central issue is how nutrient pollution affects desired or expected seagrass distribution and health. Considering expected geographic occurrence of seagrass species, biological traits, and their life history characteristics provides a good starting point for understanding their anticipated status in an estuary or coastal waterbody. This then allows water quality managers to examine how elevated levels of nitrogen and phosphorus may cause the observed distribution to differ from the expected distribution. When comparing the observed status to the potential distribution and health of seagrasses, the other chemical, physical, and biological factors potentially modulating the effect of nutrients should also be considered.

Phyllospadix species (Credit: Jim Kaldy, EPA)
Seagrass distribution and biology
Seagrasses grow in shallow, subtidal marine and estuarine environments around the United States, with 26 species found in waters of most of the U.S. and U.S. Territories (Green and Short 2003). To a more limited degree, seagrasses also grow in intertidal areas (Kaldy 2006).
Distributions for Seagrass Species in the United States
Click on a species and the map distribution changes, or click on the state/territory and the species that live there light up.
Seagrass Species
Cymodocea rotundata
Cymodocea serrulata
Enhalus acoroides
Halodule pinifolia
Halodule uninervis
Halodule wrightii
Halophila baillonii
Halophila decipiens*
Halophila engelmannii
Halophila hawaiiana
Halophila johnsonii
Halophila minor
Halophila ovalis
Halophila stipulacea**
Phyllospadix scouleri
Phyllospadix serrulatus
Phyllospadix torreyi
Ruppia maritima
Syringodium filiforme
Syringodium isoetifolium
Thalassia hemprichii
Thalassia testudinum
Zostera asiatica
Zostera japonica**
Zostera marina
Zostera pacifica
* Non-native species in Hawaii only
** Non-native species in all locations listed
Map References
IUCN Red List
This page provides links to non-EPA web sites that provide additional information about this topic. You will leave the EPA.gov domain, and EPA cannot attest to the accuracy of information on that non-EPA page. Providing links to a non-EPA Web site is not an endorsement of the other site or the information it contains by EPA or any of its employees. Also, be aware that the privacy protection provided on the EPA.gov domain (see Privacy and Security Notice) may not be available at the external link. The following links exit the site Exit
- Short, F.T., T.J.R. Carruthers, B. van Tussenbroek, and J. Zieman. 2010. Halodule wrightii. The IUCN Red List of Threatened Species 2010: e.T173372A7001725. http://dx.doi.org/10.2305/IUCN.UK.2010-3.RLTS.T173372A7001725.en.
- Short, F.T., T.J.R. Carruthers, B. van Tussenbroek, and J. Zieman. 2010. Halophila baillonii. The IUCN Red List of Threatened Species 2010: e.T173382A7004500. http://dx.doi.org/10.2305/IUCN.UK.2010-3.RLTS.T173382A7004500.en.
- Short, F.T., T.J.R. Carruthers, B. van Tussenbroek, and J. Zieman. 2010. Syringodium filiforme. The IUCN Red List of Threatened Species 2010: e.T173378A7003203. http://dx.doi.org/10.2305/IUCN.UK.2010-3.RLTS.T173378A7003203.en.
- Short, F.T., T.J.R. Carruthers, M. Waycott, G.A. Kendrick, J.W. Fourqurean, A. Callabine, W.J. Kenworthy, and W.C. Dennison. 2010. Halophila decipiens. The IUCN Red List of Threatened Species 2010: e.T173352A6997485. http://dx.doi.org/10.2305/IUCN.UK.2010-3.RLTS.T173352A6997485.en.
- Short, F.T., T.J.R. Carruthers, M. Waycott, G.A. Kendrick, J.W. Fourqurean, A. Callabine, W.J. Kenworthy, and W.C. Dennison. 2010. Halophila ovalis. The IUCN Red List of Threatened Species 2010: e.T169015A6561794. http://dx.doi.org/10.2305/IUCN.UK.2010-3.RLTS.T169015A6561794.en.
- Short, F.T., T.J.R. Carruthers, M. Waycott, G.A. Kendrick, J.W. Fourqurean, A. Callabine, W.J. Kenworthy, and W.C. Dennison. 2010. Thalassia hemprichii. The IUCN Red List of Threatened Species 2010: e.T173364A7000000. http://dx.doi.org/10.2305/IUCN.UK.2010-3.RLTS.T173364A7000000.en.
- Short, F.T., R. Coles, M. Waycott, J.S. Bujang, M. Fortes, A. Prathep, A.H.M. Kamal, T.G. Jagtap, S. Bandeira, A. Freeman, P. Erftemeije, Y.A. La Nafie, S. Vergara, H.P. Calumpong, and I. Makm. 2010. Cymodocea serrulata. The IUCN Red List of Threatened Species 2010: e.T173358A6998619. http://dx.doi.org/10.2305/IUCN.UK.2010-3.RLTS.T173358A6998619.en.
- Short, F.T., R. Coles, M. Waycott, J.S. Bujang, M. Fortes, A. Prathep, A.H.M. Kamal, T.G. Jagtap, S. Bandeira, A. Freeman, P. Erftemeije, Y.A. La Nafie, S. Vergara, H.P. Calumpong, and I. Makm. 2010. Halophila hawaiiana. The IUCN Red List of Threatened Species 2010: e.T173338A6994270. http://dx.doi.org/10.2305/IUCN.UK.2010-3.RLTS.T173338A6994270.en.
- Short, F.T., R. Coles, M. Waycott, J.S. Bujang, M. Fortes, A. Prathep, A.H.M. Kamal, T.G. Jagtap, S. Bandeira, A. Freeman, P. Erftemeije, Y.A. La Nafie, S. Vergara, H.P. Calumpong, and I. Makm. 2010. Halophila minor. The IUCN Red List of Threatened Species 2010: e.T173376A7002822. http://dx.doi.org/10.2305/IUCN.UK.2010-3.RLTS.T173376A7002822.en.
- Short, F.T., R. Coles, M. Waycott, J.S. Bujang, M. Fortes, A. Prathep, A.H.M. Kamal, T.G. Jagtap, S. Bandeira, A. Freeman, P. Erftemeije, Y.A. La Nafie, S. Vergara, H.P. Calumpong, and I. Makm. 2010. Syringodium isoetifolium. The IUCN Red List of Threatened Species 2010: e.T173332A6992969. http://dx.doi.org/10.2305/IUCN.UK.2010-3.RLTS.T173332A6992969.en.
- Short, F.T. and J. Gaeckle. 2010. Zostera pacifica. The IUCN Red List of Threatened Species 2010: e.T173373A7002177. http://dx.doi.org/10.2305/IUCN.UK.2010-3.RLTS.T173373A7002177.en.
- Short, F.T. and M. Waycott. 2010. Cymodocea rotundata. The IUCN Red List of Threatened Species 2010: e.T173363A6999692. http://dx.doi.org/10.2305/IUCN.UK.2010-3.RLTS.T173363A6999692.en.
- Short, F.T. and W. Waycott. 2010. Enhalus acoroides. The IUCN Red List of Threatened Species 2010: e.T173331A6992567. http://dx.doi.org/10.2305/IUCN.UK.2010-3.RLTS.T173331A6992567.en.
- Short, F.T. and M. Waycott. 2010. Zostera asiatica. The IUCN Red List of Threatened Species 2010: e.T173339A6994461. http://dx.doi.org/10.2305/IUCN.UK.2010-3.RLTS.T173339A6994461.en.
- Short, F.T., S.L. Williams, T.J.R. Carruthers, M. Waycott, G.A. Kendrick, J.W. Fourqurean, A. Callabine, W.J. Kenworthy, and W.C. Dennison. 2010. Halodule pinifolia. The IUCN Red List of Threatened Species 2010: e.T173327A6991467. http://dx.doi.org/10.2305/IUCN.UK.2010-3.RLTS.T173327A6991467.en.
Kolinksi, S.P., D.M. Parker, L.I. Ilo, and J.K. Ruak. 2001. An assessment of the sea turtles and their marine and terrestrial habitats at Saipan, Commonwealth of the Northern Mariana Islands. Micronesica 24(1):55-72.
Lobban, C.S. and R.T. Tsuda. 2003. Revised checklist of benthic marine macroalgae and seagrasses of Guam and Micronesia. Micronesica 35-36:54-99.
Miller, G.L. and A.E. Lugo. 2009. Guide to the Ecological Systems of Puerto Rico. General Technical Report IITF-GTR-35. USGA, Forest Service, International Institute of Tropical Forestry.
NRCS (Natural Resources Conservation Service). 2019. Plants Database. USDA, Natural Resources Conservation Service. https://plants.sc.egov.usda.gov/java/.
Ruiz, H., D.L. Balantine, and J. Sabater. 2017. Continued spread of the seagrass Halophila stipulacea in the Caribbean: documentation in Puerto Rico and the British Virgin Islands. Gulf and Caribbean Research 28(1):SC5-SC7.
Skelton, P.A. 2003. Seaweeds of American Samoa. Prepared for Department of Marine & Wildlife Resources and Government of American Samoa, by Skelton, P.A., Queensland, Australia.
Sturm, D.J., J. Stout, and T. Thibaut. 2007. Statewide summary for Alabama. In Seagrass Status and Trends in the Northern Gulf of Mexico: 1940-2002, ed. L. Dandley, D. Altsman, and R. DeMay, pp. 87-97. US Geological Survey, Reston, VA.
Tsuda, R.T., F.R. Fosberg, and M.H. Sachet. 1977. Distribution of Seagrasses in Micronesia. Micronesica 13(2):191-198.
Willette, D.A., J. Chalifour, A.O.D. Debrot, M.S. Engel, J. Miller, H.A. Oxenford, F.T. Short, S.C.C. Steiner, and F. Vedie. 2014. Continued expansion of the trains-Atlantic invasive marine angiosperm Halophila stipulacea in the Eastern Caribbean. Aquatic Botany 112:98-102.
Williams, S.L. 2007. Introduced species in seagrass ecosystems: status and concerns. Journal of Experimental Marine Biology and Ecology. 350:89-110.
The geographic extent of seagrasses is controlled by a variety of factors:
| Light | One of the primary factors governing seagrass distribution is light availability below the water surface. Seagrasses have some of the highest light requirements of plants worldwide (Dennison et al. 1993, Green and Short 2003), which confines seagrasses to shallow, nearshore waters. The average level of light required at the depth that seagrasses are growing varies based on species and environmental factors from about 10 to 30 percent of surface irradiance (Dennison et al. 1993; Kemp et al. 2004; Steward et al. 2005; Lee et al. 2007; Tables 2-4). Light requirements also vary by life stage, with seedlings generally requiring higher quantities of light than adult shoots. |
| Water depth and movement | While light availability often defines the deepest depth of seagrass distribution, the shallowest extent of seagrass distribution is often set by physical pressures of wave action and ice, as well as stress due to desiccation and extreme temperatures in shallow and intertidal habitats. The shallow ends of meadows are also susceptible to grazing from waterfowl (Rivers and Short 2007). |
| Substrate | Most seagrasses grow best in sandy or muddy sediments, as opposed to rocky or gravel substrates, with some exceptions, such as Phyllospadix spp. (World Atlas of Seagrasses, Chapter 1). |
| Salinity | Salinity is an important factor that determines where seagrasses are found. Seagrasses generally prefer polyhaline (salinity 18-30) conditions. However, salinity optima vary depending upon species and other environmental conditions: Some species of seagrasses, such as Ruppia maritima, tolerate a wide range of salinities (0-70), while others, such as Thalassia testudinum, prefer higher salinities (approximately 20-40). Large, rapid changes in salinity can have negative impacts. |
| Temperature | Optimal growth temperature will strongly affect the locations where a seagrass species is found. Tropical species have optimal temperatures for growth between approximately 23 and 32 °C, whereas temperate species require temperatures between roughly 11.5 and 26 °C (Lee et al. 2007). As with salinity, large or rapid changes in temperature can have negative impacts. Some temperate seagrasses, such as Zostera marina, prefer cold waters and are at their thermal limits in temperatures at the upper end of that range. |
| Season | Like terrestrial plants, seagrass growth varies throughout the year, with high-growth and low-growth seasons. Above-ground biomass in some seagrass beds decreases dramatically or is absent in winter. Thus, visible areal extent and seagrass shoot density can vary seasonally, with the magnitude of variability varying by taxa. |

Zostera marina (Credit: Phil Colarusso, EPA)
Factors that affect seagrass growth
Nutrient pollution affects seagrass growth through several pathways that primarily affect the amount of light available to seagrasses (Burkholder et al. 2007). When evaluating the role that nutrients play on the status of seagrasses, it is also important to account for other biological, chemical, and physical factors that may have a significant impact on seagrass response to nutrient pollution, as well as how the non-nutrient factors determine the distribution and health of seagrasses in an estuary or coastal system (Koch 2001).
Conceptual models help illustrate relationships between these factors and seagrass attributes (e.g., seagrass health, benthic community composition, seagrass areal coverage), demonstrating how the network of factors interact to influence seagrasses (Browder et al. 2005, Rudnick et al. 2005). When deriving numeric nutrient criteria to protect seagrasses, conceptual models are an important tool to help account for the key interactions of seagrasses with nutrient related factors and with other drivers in the waterbody of interest. Although each waterbody may have some unique factors at play, there are typically common interactions that influence seagrasses (Figure 1). The influence of a variety of factors on seagrasses can be found in Tables 2-4.
The role that these factors play on seagrasses is described in following sections. This discussion of the factors affecting seagrass health is not meant to be exhaustive but is intended to provide broad coverage on the topic. Additional information can be obtained in Batiuk et al. 1992, Short and Wyllie-Echeverria 1996, Batiuk et al. 2000, Hemminga and Duarte 2000, USEPA 2001, Larkum et al. 2006, Brown et al. 2007, Hagy et al. 2008, and Nelson 2009, among others.
FIGURE 1: Conceptual model of drivers of seagrass health and distribution, with a focus on nutrient effects.
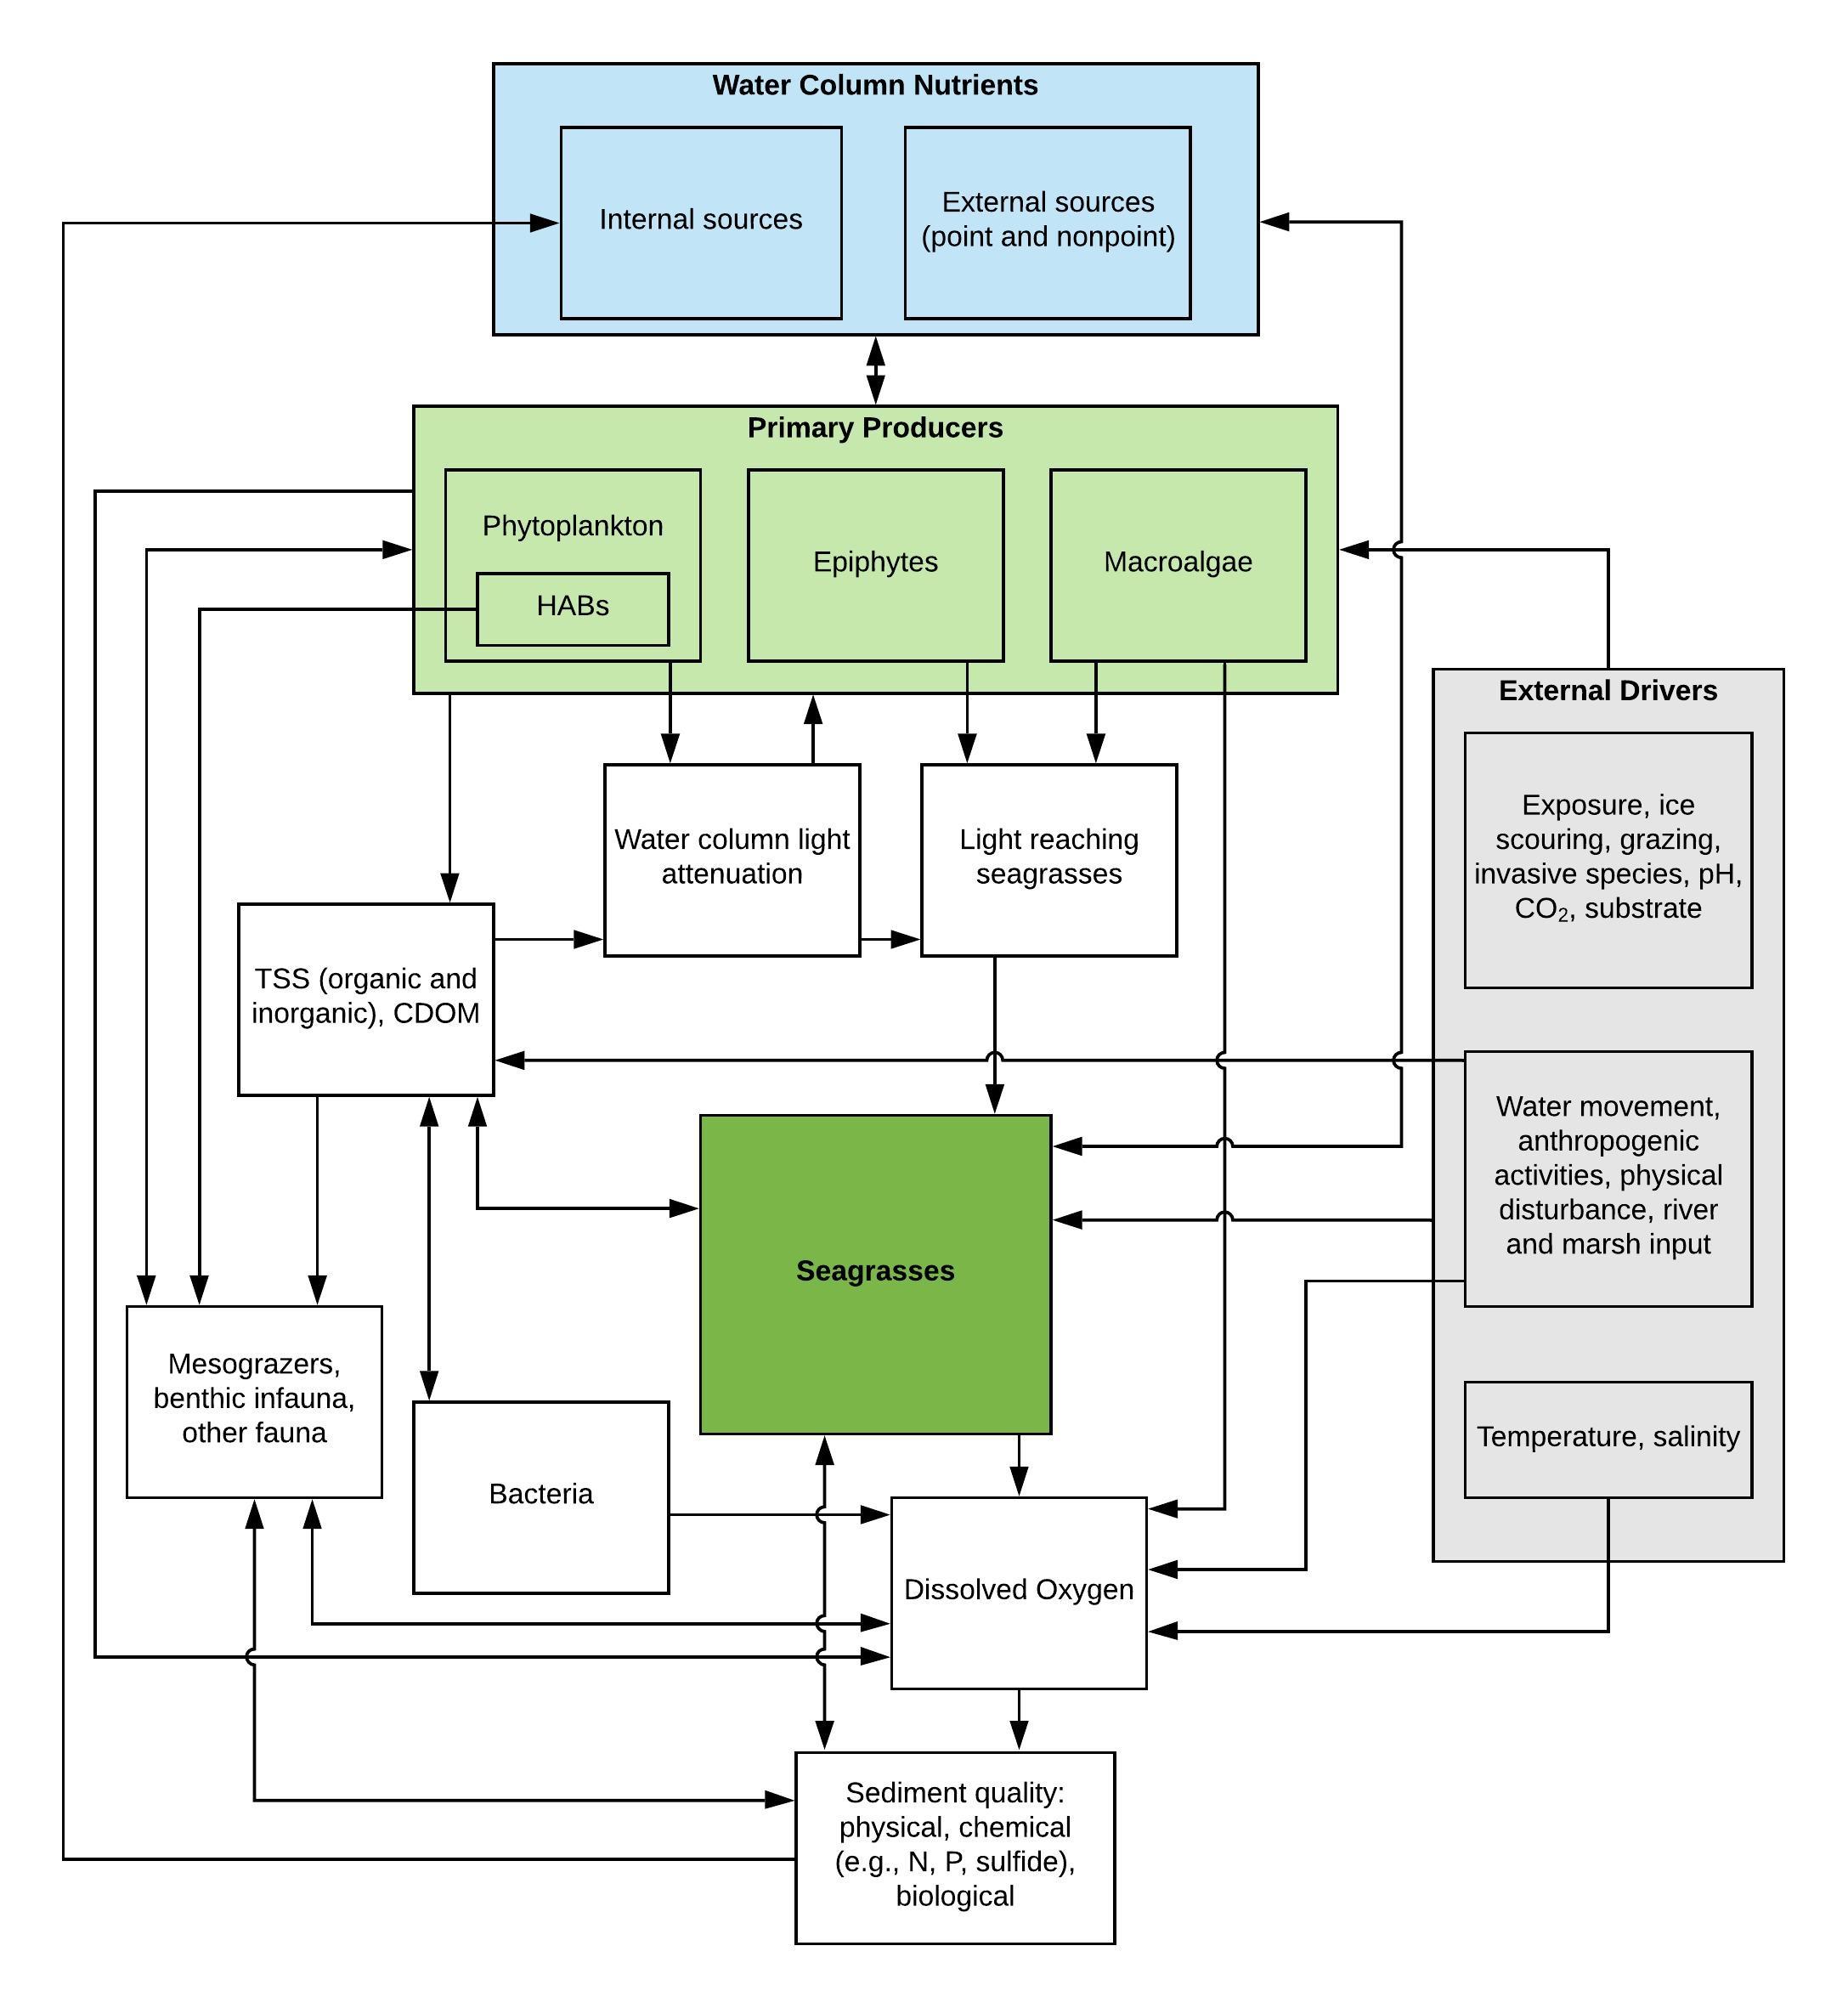
TABLE 2: Thresholds of factors that affect seagrass health. Refer to Table 2 (PDF; 250 KB). EXIT
TABLE 3: Relationships between seagrass depth of colonization and environmental factors. Refer to Table 3 (PDF; 238 KB). EXIT
TABLE 4: Relationships between seagrass abundance and environmental factors. Refer to Table 4 (PDF; 225 KB). EXIT
Light availability – nutrient and non-nutrient impacts
The general mechanism by which nutrient pollution affects the light environment for seagrasses is well understood. Increased nutrient availability stimulates primary productivity, thereby increasing the abundance of algae and other organic material in the water column, on the benthos among seagrasses, and on the seagrass leaves. This additional material absorbs and reflects light, reducing the amount of light reaching seagrasses. Reduced average light availability harms seagrasses by reducing their energetic potential to grow and overcome other natural and anthropogenic physiological stressors. Because seagrasses “leak” oxygen into otherwise anoxic sediments, and photosynthesis is a primary source of oxygen to benthic environments, reduced primary production can also lead to increased redox stress in the below-ground biomass of seagrass (Borum et al. 2007).
The mechanisms of nutrient-related effects on seagrass point to several potential water quality related indicators tied to a seagrass endpoint. Like seagrasses, phytoplankton, macroalgae, and epiphytes are primary producers and are among the first organisms to respond to nutrient pollution in a waterbody. Among these, however, only seagrasses also can obtain and retain nutrients from sediments, making them good competitors in low-nutrient regimes. Under conditions of elevated water column nutrients, seagrass competitors are better able to increase in biomass. Because these organisms either occupy the water column (e.g., phytoplankton) or can directly shade seagrasses (e.g., macroalgae and epiphytes), their increased biomass can decrease the light reaching seagrasses and cause a variety of other issues (Tables 2-4).
Foremost, water column chlorophyll a (chl a), which is a widely used indicator of phytoplankton biomass, is sensitive to changes in nutrient concentrations and can be a key component in attenuation of light in the water column. Although colored dissolved organic material (CDOM) and suspended sediments are often important, or even dominant, components of water column light attenuation, chl a relates to the component of light attenuation most closely related to nutrient pollution. Regulatory limits for chl a have been adopted for many areas to limit light attenuation due to water column algal biomass, either alone or in combination with water clarity criteria, both in the context of numeric water quality standards or translations of narrative water quality standards in TMDLs. For example, chl a has been used as an endpoint for nutrient reduction efforts to protect seagrasses in Tampa Bay, Chesapeake Bay, Long Island Sound, and Massachusetts (Janicki and Wade 1996, Janicki et al. 2001, Tango and Batiuk 2013, Vaudrey et al. 2013, MEP 2019). California is also considering water column algal biomass as a primary numeric nutrient endpoint for estuaries to implement their narrative water quality standard (Sutula and Senn 2015).

Thalassia testudinum (Credit: Galen Kaufman, EPA)
Microalgae growing as epiphytes on seagrass leaves can be an important nutrient-related mechanism that reduces light reaching seagrasses, especially when ecosystem changes have reduced the abundance of grazers that remove epiphytes, often called “mesograzers”, which may otherwise prevent such overgrowth (Heck et al. 2000; Kemp et al. 2004; Nelson 2017 a, b). However, regulatory approaches have generally not directly quantified epiphyte impacts on seagrasses because the epiphyte load and subsequent light reduction are highly variable both spatially and temporally, even at the scale of individual plants. There are also differences in epiphyte load between wet and dry seasons, location in the estuary, and between younger inner leaves and older outer leaves. Sampling epiphytes sufficiently is challenging enough that they are generally not quantified in most seagrass monitoring programs or are quantified only using comparative changes in abundance over time or space (Sutula et al. 2011).
Whereas phytoplankton biomass and epiphytes primarily decrease the amount of light reaching seagrasses, macroalgae, in addition to reducing light available to seagrasses, can also accumulate in seagrass beds, smothering seagrass and reducing oxygenation of sediments, thereby harming seagrass roots and rhizomes (Hauxwell et al. 2001). A review by Young (2009) showed that macroalgae generally have negative impacts on Zostera spp. and Thalassia testudinum, often causing loss or complete replacement of seagrasses through shading or elevated sediment anoxia (see DO discussion in next section). Furthermore, a meta-analysis by Thomsen et al. (2012) affirmed the negative impacts of macroalgae on seagrasses, with the magnitude of impact being influenced by type of macroalgae, how they are attached to the benthos, and the size of seagrasses. However, although proliferation of macroalgae is a documented cause of seagrass loss in many estuaries (Valiela et al. 1997, Hauxwell et al. 2001, McGlathery et al. 2007, Young 2009, Thomsen et al. 2012), macroalgal abundance is, like epiphytes, not widely quantified and analyzed as a factor in the relationship between seagrass health and nutrient pollution in regulatory settings. One possibility is that relationships between macroalgae and seagrass are complex or context-dependent (Hessing-Lewis et al. 2011). Another possibility is that appropriate and practical measures of macroalgae abundance are not well developed in relation to effects on seagrass. For example, macroalgae could be measured as percent cover, thickness of canopy, or biomass. Spatial and temporal variability also present a challenge, since macroalgae are usually patchy, often breaking free from their benthic attachments, accumulating, and drifting to other locations based on currents. However, particularly in shallow estuaries (e.g., Waquoit Bay, Hauxwell et al. 2001), macroalgae may be a relatively important factor to be considered as a nutrient-related stressor of seagrasses.
Light attenuation in the water column is not only due to stimulation of primary productivity by nutrient pollution (Gallegos and Moore 2000). Total suspended solids (TSS) and CDOM also affect light available to seagrass and thus seagrass growth and distribution. Although these factors can be affected by nutrient pollution, increased TSS and CDOM are frequently caused by other human activities (e.g., dredging, hydrological modification, watershed modification) and natural events (e.g., hurricanes, increases in river flow, wind and tide-driven sediment resuspension). Often, TSS is related to freshwater inflow, and is an important confounding factor to note in the nutrient pollution-seagrass relationship. CDOM is similarly associated with river flow, although input from marsh environments is another common source. The interaction of chl a with other light attenuating factors can be seen in some of the examples in Tables 2-4.
Ecological interactions beyond light and nutrients

Zostera marina and Zostera japonica (center) (Credit: Jeff Gaeckle, Washington Department of Natural Resources)
Seagrasses and their responses to nutrient pollution can be affected by biological interactions other than those that impact light. Examples include grazing on seagrasses and their epiphytes, invasive species effects, diseases affecting seagrasses, and modification of plant-sediment interactions by benthic fauna. When developing numeric nutrient criteria using seagrasses as an endpoint, it is helpful to conceptually, if not numerically, account for how these factors may or may not be impacting seagrass status in the target ecosystem.
Seagrasses and the algae that grow on them are grazed by a variety of herbivores (Valentine and Duffy 2006; Zieman 1982, Chapter 6). Grazing of seagrasses themselves, such as by turtles, manatees, urchins, fish, crabs, and birds, while temporally and spatially variable and generally limited, frequently due to reductions of grazer populations from historical levels, can be locally significant at times (Jackson 2001, Valentine and Duffy 2006). Overall, direct grazing on seagrasses can change the condition of seagrass beds in complex ways, although immediate effects are manifest as reductions in distribution or abundance (Valentine and Duffy 2006). Mesograzers benefit seagrasses by increasing the amount of light that reaches seagrass leaves. Mesograzer abundance is affected by trophic interactions that can modulate epiphyte effects related to overgrowth (Heck et al. 2000).
Invasive species widely impact coastal ecosystems. Invasive species affecting seagrasses are taxonomically diverse and can include macroalgae, non-native seagrasses, and both invertebrate and vertebrate animals (Williams 2007). One example is non-native anemones and tunicates on both east and west coasts of the United States that grow on seagrass leaves, shading seagrass directly and weighing down seagrass leaves, causing them to eventually collapse (Williams 2007, Wong and Vercaemer 2012, Carman et al. 2016). In areas of the United States that have experienced significant population growth of the invasive European Green Crab, Carcinus maenas, widespread negative effects have been observed in seagrass meadows as a result of bioturbation damage to shoots and rhizomes (Malyshev and Quijon 2011, Neckles 2015). Observations of competition between non-native Zostera japonica and native species have not been widespread, although they have been observed in some places (Shafer et al. 2014). In the Caribbean, Halophila stipulaceae has been spreading extensively, including in Puerto Rico and the U.S. Virgin Islands, with indications that it is having impacts on native seagrasses (Willette and Ambrose 2012, Willette et al. 2014).
Seagrasses can also be affected on a large scale by diseases, resulting in episodic declines in coverage. An early example is eelgrass wasting disease, caused by slime mold of the genus Labyrinthula, which destroyed approximately 90 percent of all eelgrass along the western North Atlantic in the 1930s (Muehlstein 1989). The disease has since been found to occur in other estuaries around the country, in places such as New Hampshire, Massachusetts, Washington, Florida, and North Carolina (Short et al. 1987, Sullivan et al. 2013).
Harmful algal blooms (HABs), which are an important concern from both a human health and aquatic life perspective, also can affect seagrass growth. Because they form dense blooms, their impact on light availability can be dramatic and abrupt, causing acute impacts on seagrasses, including seagrass die-offs, characterized by widespread loss of seagrass shoots over a short period of time (Lee et al. 2007, Lopez et al. 2008). HAB effects can be magnified when blooms decline, causing oxygen depletion from the decay of organic matter, in turn driving a variety of negative impacts (see following section). Finally, HAB toxicity may also impact mesograzers, favoring epiphyte overgrowth. In combination, these consequences of HABs can lead to dramatic declines in seagrass coverage. For example, in Indian River Lagoon, Florida, increasing nutrient levels, combined with other factors, led to intense and protracted blooms from 2010-2013 characterized by monthly average chl a levels from approximately 50 µg/L to 200 µg/L (Gobler et al. 2013, Phlips et al. 2015, Barile 2018). The decrease in light attenuation caused by the blooms was one of the factors associated with a subsequent widespread and rapid loss of seagrass species (Phlips et al. 2015).
Although sediment bioturbation (i.e., burrowing, sediment re-working, feeding activities) and bioirrigation (i.e., ventilation of burrows and tubes) may affect seagrass growth, these factors are generally not used in water quality management programs when evaluating confounding impacts on seagrass responses to nutrients. This is typically because temporal and spatial availability of data is low and variability of measurements can be high, and because sampling can be difficult and costly. In general, bioturbation has been associated with negative effects on seagrass, whereas bioirrigation has been associated with positive or neutral effects; however, the effect, magnitude, and spatial scale is variable and can be site dependent (Short and Wyllie-Echeverria 1996, Nelson 2009).
Salinity, pH and dissolved oxygen
Whereas many seagrass taxa are adapted to short term changes in salinity, and often tolerate sustained exposure to a broad range of salinity, extreme and sustained changes can affect seagrass health and distribution, with tolerance ranges that vary by species (Tables 2-4). For example, eelgrass (Zostera marina) tolerates salinity from 5 to 42, making it tolerant of the full range of salinity that typically occurs in estuaries (i.e., euryhaline), exclusive of hypersaline waters. In contrast, turtle grass (Thalassia testudinum), which dominates seagrass species in Florida and the Caribbean, is less tolerant of low salinity, preferring polyhaline to euhaline environments (salinity between 17 and 48). Changes in estuarine hydrology associated with changes in climate or weather extremes, freshwater diversions, or dredge and fill activities can change temporal and spatial patterns of salinity in estuaries, which affects seagrass growth, distribution, and species composition (Boese 2009).
Because seagrasses are primary producers, their growth requires assimilation of CO2 from the water. Because seagrasses are usually not saturated with respect to CO2, increased CO2 associated with increased atmospheric CO2 generally benefits seagrass growth (Koch et al. 2013). However, other factors associated with increased dissolved CO2, such as pH and other acidification-related effects, have complex effects on seagrasses as well.
Dissolved oxygen is an important water quality variable affecting the ecological processes of estuaries because of its effects on biogeochemical transformations and the physiology of marine species. The interaction between DO and seagrasses is dynamic. Because seagrasses are present in shallow waters, they are unlikely to be affected by seasonally persistent hypoxia associated with the bottom layer of stratified waters. In contrast, seagrasses may be most affected by diel cycling hypoxia, wherein low oxygen occurs overnight, and in low oxygen micro-habitats. Seagrasses can contribute directly to diel cycling via strong primary production by seagrasses and associated epiphytes, and through high oxygen consumption associated with heterotrophic metabolism. Mortality or other diminishment of mesograzer abundance or activity resulting from low DO can lead to increased epiphytic algal overgrowth, reducing primary production by seagrasses and associated oxygen flux to below-ground biomass. Sediment anoxia can increase sulfide in sediment and associated phytotoxicity, resulting in metabolic stress on below-ground seagrass biomass. Finally, low DO micro-habitats may also be formed in seagrass beds with high macroalgal cover. Hypoxia or anoxia beneath a macroalgae canopy likely promotes more reducing conditions in sediments and at the sediment water interface (Valiela et al. 1997, Hauxwell et al. 2001, McGlathery et al. 2007). This can stress seagrasses physiologically while increasing nutrient recycling via sediment ammonium and phosphorus releases into the water column (McGlathery et al. 2007).
Water temperature and water movement/physical disturbance
Optimal temperature varies among seagrass species (Bulthuis 1987; Koch et al. 2013, Tables 2-4). Seagrasses experience physiological stress when temperatures are outside their optimal temperature range, which may reduce growth and fitness, making them more vulnerable to other stressors (e.g., the effects of nutrient pollution) and increasing the likelihood of mortality (Lee et al. 2007, Phlips et al. 2015). The probability of thermal impacts is higher where a seagrass species is at the edge of its thermal tolerance, particularly temperate species, or extreme fluctuations of temperature occur (Thom et al. 2003, Koch et al. 2013, Moore et al. 2014, Arnold et al. 2017, Lefcheck et al. 2017). Temperature fluctuations are associated with altered hydrology, point source discharges, and changing climate.
Seagrasses rely on water movement to bring nutrients, but water movement can also affect the physical stability of the environment around seagrasses. Anthropogenic activities such as freshwater diversions, channelization, shoreline hardening, and damming can modify the current and wave exposure of seagrass communities, impacting growth and distribution (Patrick et al. 2016, Prosser et al. 2018). These alterations affect salinity patterns, tidal dynamics, and circulation patterns, in addition to the supply of nutrients, toxics, and sediments. Boat and ship traffic also affect seagrasses by physically removing or disturbing seagrasses and by producing currents and waves that decrease sediment stability. Other factors such as storms and hurricanes influence the survival and distribution of seagrasses through physical disturbance.
Measuring Seagrass Change
Examining how changes in seagrass distribution and condition over time are related to contemporaneous changes in nutrient pollution loading and associated water quality variables is a powerful and widely used way to understand effects of water quality on seagrasses (Latimer and Rego 2010). Evaluating spatially-related patterns of water quality and seagrass status is similarly useful. Central to both approaches are reliable and effective methods for quantifying seagrass distribution and condition. Fortunately, such methods are well-developed. In fact, the existence of reliable methods to quantify seagrass distribution and change over time is an important reason that seagrasses are useful as an assessment endpoint for water quality management.
Existing methods to evaluate seagrass most often focus on areal distribution, or “seagrass coverage”, which is closely related to another widely used metric, maximum depth of colonization. Other approaches focus on the condition and health of seagrass habitats, such as percent cover or shoot density, which is distinct from the magnitude of seagrass coverage. Selection of the best measures to use in numeric nutrient criteria derivation depends in part on available data, resources available for ongoing monitoring and assessment, and the scale of interest.
Areal distribution
Regardless of method chosen, the user should decide how to define what constitutes seagrass existence in an area. Some organizations use a percent cover metric (e.g., 10% cover) to define a minimum threshold, while others consider presence of any seagrass the threshold. Other times, presence/absence is used, sometimes parsing into dense, sparse, or absent categories. If presence/absence is used it should be kept in mind that often many changes have occurred in a seagrass meadow before seagrass no longer occurs in an area.
Areal coverage can be an effective way to present data to the public, and to identify conspicuous, long-term impacts, but may not alone capture other shifts like changes in seagrass density or species composition.
Maximum depth of colonization
The maximum depth limit can be defined in a variety of ways, such as the limits of well-defined meadows or shoots, or the mean or median depth of occurrence. There is some natural variability in the movement of the edge, so it can be useful to have a reference meadow or have long-term measurements to evaluate whether change is within normal variation. The maximum depth of colonization is often quantified using the same methods used to determine areal cover and evaluated to track changes over time.
Shoot density and percent cover
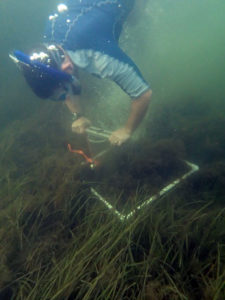
Measuring seagrass biomass (Credit: U.S. Geological Survey, Woods Hole Coastal and Marine Science Center EXIT, public domain)
Shoot density is another commonly used metric of seagrass abundance and expresses the number of shoots per unit area. Measures of seagrass density have been the backbone of many seagrass monitoring plans and are robust and repeatable (Fourqurean et al. 2001, Sutula et al. 2011). Density estimates are typically made by counting the number of shoots in a known area using divers or coring methods. Field counts are generally scaled and reported per unit area. Alternatively, large scale seagrass monitoring programs (e.g., Florida Bay) often utilize rapid visualization techniques, such as the Braun-Blanquet method, to classify shoot density into density categories (Fourqurean et al. 2001). Both methods require reasonable visibility to make estimates and put divers or snorkelers into the water to make measurements. Remote sensing-based methods are being explored which may ease the need for divers in the water, but still require acceptable water clarity.
A related measure to shoot density is percent cover, which is affected by both shoot density and shoot length. This measure can be less sensitive to light changes than density because with increasing depth (and decreasing light) shoot density generally decreases but shoot length increases. Additionally, estimates of percent cover can vary with tidal stage, particularly in intertidal zones, and with the individual making the measurement. If this metric is used, these sources of variability should be considered and accounted for.
As the ability to track changes in depth of colonization and areal coverage have become more accessible, shoot density and percent cover are often used as supporting measures.
Additional seagrass measures
Additional considerations for measuring seagrasses
Temporal or spatial reference approaches (described in the Reference Condition section) can be important tools for numeric nutrient criteria development using seagrasses (e.g., Tampa Bay). To use a temporal based reference, having comparable methods over time is important to allow the incorporation of long-term datasets. If comparisons are to be made between waterbodies, having comparable methods across a region is useful.
Lastly, when developing numeric nutrient criteria, it is also important to recognize potential limitations of the methods needed to monitor, such as the cost or amount of required effort, as it may affect the feasibility of maintaining the monitoring program in the future. With the increasing availability of remote sensing derived measures and the ability to analyze them in an automated fashion, the cost and effort needed to monitor can be greatly reduced. Additionally, other free resources such as SeagrassNet (www.seagrassnet.org Exit) can be useful sources of information.
Methods
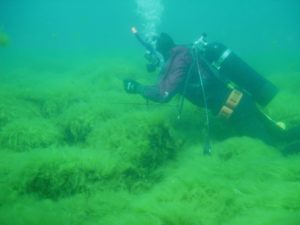
Cladophera glomerata algae (Credit: Brenda Lafrancois, National Park Service EXIT, public domain)
Because of the well-established negative relationship between nutrient pollution and seagrass health, water quality managers can use the variety of metrics indicative of seagrass condition to develop numeric nutrient criteria and environmental goal setting. These measures have been used in estuaries and coastal areas around the country to help programs address nutrient pollution. The metrics used are often descriptive of the established pathway through which excess nutrients reduce the amount of light available to seagrasses. For example, measures such as areal distribution and depth of colonization are commonly used and have been applied to evaluate seagrass health and to further develop criteria and TMDLs to manage nutrients in Florida, Chesapeake Bay, and Tampa Bay. Refer to the Case Studies page for more information about the methods used by these programs.
References
References
Abal, E.G., and W.C. Dennison. 1996. Seagrass depth range and water quality in southern Moreton Bay, Queensland, Australia. Freshwater Resources 47:763–771.
Apostolaki, E.T., M. Holmer, V. Santinelli, and I. Karakassis. 2018. Species-specific response to sulfide intrusion in native and exotic Mediterranean seagrasses under stress. Marine Environmental Research 134:85–95.
Arnold, T.M., R.C. Zimmerman, K.A.M. Engelhardt, and J.C. Stevenson. 2017. Twenty-first century climate change and submerged aquatic vegetation in a temperate estuary: the case of Chesapeake Bay. Ecosystem Health and Sustainability 3(7):1353283.
Barile, P.J. 2018. Widespread sewage pollution of the Indian River Lagoon system, Florida (USA) resolved by spatial analyses of macroalgal biogeochemistry. Marine Pollution Bulletin 128:557–574.
Barry, S.C., C.A. Jacoby, and T.K. Frazer. 2017. Environmental influences on growth and morphology of Thalassia testudinum. Marine Ecology Progress Series 570:57–70.
Batiuk, R., R. Orth, K. Moore, J.C. Stevenson, W. Dennison, L. Staver, V. Carter, N. Rybicki, R. Hickman, S. Kollar, and S. Bieber. 1992. Submerged Aquatic Vegetation Habitat Requirements and Restoration targets: A Technical Synthesis. U.S. Environmental Protection Agency, Chesapeake Bay Program, Annapolis, Maryland.
Batiuk, R.A., P. Bergstrom, M. Kemp, E. Koch, L. Murray, J.C. Stevenson, R. Bartleson, V. Carter, N.B. Rybicki, J.M. Landwehr, C. Gallegos, L. Karrh, M. Naylor, D. Wilcox, K. A. Moore, S. Ailstock, and M. Teichberg. 2000. Chesapeake Bay Submerged Aquatic Vegetation Water Quality and Habitat-based Requirements and Restoration Targets: A Second Technical Synthesis. U.S. Environmental Protection Agency, Chesapeake Bay Program, Annapolis, Maryland.
Beck, M.W., J.D. Hagy, and C. Le. 2017. Quantifying seagrass light requirements using an algorithm to spatially resolve depth of colonization. Estuaries and Coasts 41(2):592–610.
Bernardeau-Esteller, J., J.M. Ruiz, F. Tomas, J.M. Sandoval-Gil, and L. Marín-Guirao. 2015. Photoacclimation of Caulerpa cylindracea: Light as a limiting factor in the invasion of native Mediterranean seagrass meadows. Journal of Experimental Marine Biology and Ecology 465:130–141.
Berry, H.D., A.T. Sewell, S. Wyllie-Echeverria, B.R. Reeves, T.F. Mumford, Jr., J.R. Skalski, R.C. Zimmerman, and J. Archer. 2003. Puget Sound Submerged Vegetation Monitoring Project: 2000-2002 Monitoring Report. Nearshore Habitat Program, Washington State Department of Resources, Olympia, Washington.
Bertelli, C.M., and R.K. Unsworth. 2018. Light stress responses by the eelgrass, Zostera marina (L). Frontiers in Environmental Science 6(39):1–13.
Bittick, S.J., M. Sutula, and P. Fong. 2018. A tale of two algal blooms: Negative and predictable effects of two common bloom-forming macroalgae on seagrass and epiphytes. Marine Environmental Research 140:1–9.
Boese, B.L. 2009. Salinity as a limiting factor for the seagrasses Zostera marina and Thalassia testudinum. In Seagrasses and Protective Criteria: A Review and Assessment of Research Status, ed. W.G. Nelson. EPA/600/R-09/050. U.S. Environmental Protection Agency, Office of Research and Development, National Health and Environmental Effects Research Laboratory.
Borja, A., A. Basset, S. Bricker, J. Dauvin, M. Elliot, T. Harrison, J. Marques, S. Weisberg, and R. West. 2012. Classifying ecological quality and integrity of estuaries. In Treatise on Estuarine and Coastal Science, eds. E. Wolanski and D. McLusky. Waltham: Academic Press. pp. 125–162.
Borum, J., K. Sand-Jensen, T. Binzer, O. Pedersen, and T.M. Greve. 2007. Oxygen Movement in Seagrasses. In Seagrasses: Biology, Ecology, and Conservation. Springer, The Netherlands. pp. 255–270.
Boynton, W.R., L. Murray, J.D. Hagy, C. Stokes, and W.M. Kemp. 1996. A comparative analysis of eutrophication patterns in a temperate coastal lagoon. Estuaries 19(2):408–421.
Bricker, S.B., C.G. Clement, D.E. Pirhalla, S.P. Orlando, and D.R.G. Farrow. 1999. National Estuarine Eutrophication Assessment: Effects of Nutrient Enrichment in the Nation’s Estuaries. NOAA, National Ocean Service, Special Projects Office and the National Centers for Coastal Ocean Science, Silver Spring, Maryland.
Bricker, S.B., J.B. Ferreira, and T. Simas. 2003. An integrated methodology for assessment of estuarine trophic status. Ecological Modelling 169:39–60.
Bricker, S., B. Longstaff, W. Dennison, A. Jones, K. Boicourt, C. Wicks, and J. Woerner. 2007. Effects of Nutrient Enrichment in the Nation’s Estuaries: A Decade of Change. NOAA Coastal Ocean Program Decision Analysis Series No. 26. National Centers for Coastal Ocean Science, Silver Spring, Maryland.
Brodersen, K.E., M. Lichtenberg, L.C. Paz, and M. Kühl. 2015. Epiphyte-cover on seagrass (Zostera marina L.) leaves impedes plant performance and radial O2 loss from the below-ground tissue. Frontiers in Marine Science 2(58):1–11.
Browder, J.A., R. Alleman, S. Markley, P. Ortner, and P.A. Pitts. 2005. Biscayne Bay conceptual ecological model. Wetlands 25(4):854–869.
Brown, C.A., W.G. Nelson, B.L. Boese, T.H. DeWitt, P.M. Eldridge, J.E. Kaldy, H. Lee II, J.H. Power, and D.R. Young. 2007. An Approach to Developing Nutrient Criteria for Pacific Northwest Estuaries: A Case Study of Yaquina Estuary, Oregon. EPA/600/R-07/046. US Environmental Protection Agency, Office of Research and Development, National Health and Environmental Effects Laboratory, Western Ecology Division, Newport, Oregon.
Browne, N.K., S.M. Yaakub, J.K. Tay, and P.A. Todd. 2017. Recreating the shading effects of ship wake induced turbidity to test acclimation responses in the seagrass Thalassia hemprichii. Estuarine, Coastal and Shelf Science 199:87–95.
Brun, F.G., I. Hernandez, J.J. Vergara, G. Peralta, and J.L. Perez-Llorens. 2002. Assessing the toxicity of ammonium pulses to the survival and growth of Zostera noltii. Marine Ecology Progress Series 225:177–187.
Bulthuis, D.A. 1987. Effects of temperature on photosynthesis and growth of seagrasses. Aquatic Botany 27(1):27–40.
Burkholder, J.M., D.A. Tomasko, and B.W. Touchette. 2007. Seagrasses and eutrophication. Journal of Experimental Marine Biology and Ecology 350:46–72.
Burnell, O.W., B.D. Russell, A.D. Irving, and S.D. Connell. 2014. Seagrass response to CO2 contingent on epiphytic algae: Indirect effects can overwhelm direct effects. Oecologia 176(3):871–882.
Cambridge, M.L., A. Zavala-Perez, G.R. Cawthray, J. Mondon, and G.A. Kendrick. 2017. Effects of high salinity from desalination brine on growth, photosynthesis, water relations and osmolyte concentrations of seagrass Posidonia australis. Marine Pollution Bulletin 115:252–260.
Carman, M.R., P.D. Colarusso, E.P. Nelson, D.W. Grunden, M.C. Wong, C. McKenzie, K. Matheson, J. Davidson, S. Fox, H.A. Neckles, H. Bayley, S. Schott, J.A. Dijkstra, and S. Stewart-Clark. 2016. Distribution and diversity of tunicates utilizing eelgrass as substrate in the western North Atlantic between 39° and 47° north latitude (New Jersey to Newfoundland). Management of Biological Invasions 7(1):51–57.
Carr, J.A., P. D’Odorico, K.J. McGlathery, and P.L. Wiberg. 2016. Spatially explicit feedbacks between seagrass meadow structure, sediment and light: Habitat suitability for seagrass growth. Advances in Water Resources 93:315–325.
Chartrand, K.M., C.V. Bryant, A.B. Carter, P.J. Ralph, and M.A. Rasheed. 2016. Light thresholds to prevent dredging impacts on the Great Barrier Reef seagrass, Zostera muelleri ssp. capricorni. Frontiers in Marine Science 3(106):1–17.
Chartrand, K.M., M. Szabó, S. Sinutok, M.A. Rasheed, and P.J. Ralph. 2018. Living at the margins–The response of deep-water seagrasses to light and temperature renders them susceptible to acute impacts. Marine Environmental Research 136:126–138.
Choice, Z.D., T.K. Frazer, and C.A. Jacoby. 2014. Light requirements of seagrasses determined from historical records of light attenuation along the Gulf coast of peninsular Florida. Marine Pollution Bulletin 81(1):94–102.
Clinton, P.J., D.R. Young, D.T. Specht, and H. Lee II. 2007. A Guide to Mapping Intertidal Eelgrass and Nonvegetated Habitats in Estuaries of the Pacific Northwest USA. EPA/600/R-07/062. U.S. Environmental Protection Agency, Office of Research and Development, National Health and Environmental Effects Research Laboratory, Western Ecology Division, Newport, Oregon.
Cognat, M., F. Ganthy, I. Auby, F. Barraquand, L. Rigouin, and A. Sottolichio. 2018. Environmental factors controlling biomass development of seagrass meadows of Zostera noltei after a drastic decline (Arcachon Bay, France). Journal of Sea Research 140:87–104.
Cole, A.M., M.J. Durako, and M.O. Hall. 2018. Multivariate analysis of water quality and benthic macrophyte communities in Florida Bay, USA reveals hurricane effects and susceptibility to seagrass die-off. Frontiers in Plant Science 9(530):1–16.
Collier, C.J., and M. Waycott. 2014. Temperature extremes reduce seagrass growth and induce mortality. Marine Pollution Bulletin 83(2):483–490.
Cox, T.E., F. Gazeau, S. Alliouane, I. Hendriks, P. Mahacek, A. Le Fur, and J.P. Gattuso. 2016. Effects of in situ CO2 enrichment on structural characteristics, photosynthesis, and growth of the Mediterranean seagrass Posidonia oceanica. Biogeosciences 13:2179–2194.
Dahlgren, S., and L. Kautsky. 2004. Can different vegetative states in shallow coastal bays of the Baltic Sea be linked to internal nutrient levels and external nutrient load? Hydrobiologia 514:249–258.
Dennison, W.C. 1987. Effects of light on seagrass photosynthesis, growth and depth distribution. Aquatic Botany 27:15–26.
Dennison, W.C., R.J. Orth, K.A. Moore, J.C. Stevenson, V. Carter, S. Kollar, P.W. Bergstrom, and R.A. Batiuk. 1993. Assessing water quality with submersed aquatic vegetation: habitat requirements as barometers of Chesapeake Bay health. BioScience 43(2):86–94.
Dobberfuhl, D.R. 2007. Light limiting thresholds for submerged aquatic vegetation in a blackwater river. Aquatic Botany 86:346–352.
Dowty, P., H. Berry, and J. Gaeckle. 2010. Developing indicators and targets for Eelgrass in Puget Sound. Washington State Department of Natural Resources, Aquatic Resources Division, Olympia, Washington.
Duarte, C.M. 1991. Seagrass depth limits. Aquatic Botany 40:363–377.
Duarte, C.M., N. Marba, D. Krause-Jensen, and M. Sanchez-Camacho. 2007. Testing the predictive power
of seagrass depth limit models. Estuaries and Coasts 30(4):652–656.
Duffy, J.E., P.L. Reynolds, C. Boström, J.A. Coyer, M. Cusson, S. Donadi, J.G. Douglass, J.S. Eklöf, A.H. Engelen, B.K. Eriksson, and S. Fredriksen. 2015. Biodiversity mediates top–down control in eelgrass ecosystems: A global comparative‐experimental approach. Ecology Letters 18:696–705.
Dunton, K.H. 1994. Seasonal growth and biomass of the subtropical seagrass Halodule wrightii in relation to continuous measurements of underwater irradiance. Marine Biology 120:479–489.
Egea, L.G., R. Jiménez-Ramos, J.J. Vergara, I. Hernández, and F.G. Brun. 2018. Interactive effect of temperature, acidification and ammonium enrichment on the seagrass Cymodocea nodosa. Marine Pollution Bulletin 134:14–26.
Eriander, L. 2017. Light requirements for successful restoration of eelgrass (Zostera marina L.) in a high latitude environment–Acclimatization, growth and carbohydrate storage. Journal of Experimental Marine Biology and Ecology 496:37–48.
Fernandes, M.B., R. Daly, J. van Gils, T. Kildea, S. Caires, and P.L. Erftemeijer. 2018. Parameterization of an optical model to refine seagrass habitat requirements in an urbanized coastline. Estuarine, Coastal and Shelf Science 207:471–482.
Ferreira, C., C. Simioni, E.C. Schmidt, F. Ramlov, M. Maraschin, and Z.L. Bouzon. 2016. The influence of salinity on growth, morphology, leaf ultrastructure, and cell viability of the seagrass Halodule wrightii Ascherson. Protoplasma 254:1529–1537.
Ferreira, J.G., J.H. Andersen, A. Borja, S.B. Bricker, J. Camp, M.C. da Silva, E. Garcés, A.-S. Heiskanen, C. Humborg, L. Ignatiades, C. Lancelot, A. Menesguen, P. Tett, N. Hoepffner, and U. Claussen. 2011. Overview of eutrophication indicators to assess environmental status within the European Marine Strategy Framework Directive. Estuarine, Coastal and Shelf Science 93:117–131.
Fourqurean, J.W., A. Willsie, C.D. Rose, and L.M. Rutten. 2001. Spatial and temporal pattern in seagrass community composition and productivity in south Florida. Marine Biology 138:341–354.
Gallegos, C., and K.A. Moore. 2000. Factors contributing to water-column light attenuation. In R. A. Batiuk, P. Bergstrom, M. Kemp, E. Koch, L. Murray, J.C. Stevenson, R. Bartleson, V. Carter, N.B. Rybicki, J.M. Landwehr, C. Gallegos, L. Karrh, M. Naylor, D. Wilcox, K. A. Moore, S. Ailstock, and M. Teichberg. Chesapeake Bay Submerged Aquatic Vegetation Water Quality and Habitat-based Requirements and Restoration Targets: A Second Technical Synthesis. U.S. Environmental Protection Agency, Chesapeake Bay Program, Annapolis, Maryland. pp. 35–54.
Garthwin, R.G., A.G. Poore, and A. Vergés. 2014. Seagrass tolerance to herbivory under increased ocean temperatures. Marine Pollution Bulletin 83:475–482.
George, R., M. Gullström, M.M. Mangora, M.S. Mtolera, and M. Björk. 2018. High midday temperature stress has stronger effects on biomass than on photosynthesis: A mesocosm experiment on four tropical seagrass species. Ecology and Evolution 8:4508–4517.
Gladstone-Gallagher, R.V., R.W. Hughes, E.J. Douglas, and C.A. Pilditch. 2018. Biomass-dependent seagrass resilience to sediment eutrophication. Journal of Experimental Marine Biology and Ecology 501:54–64.
Gobler, C.J., F. Koch, Y. Kang, D.L. Berry, Y.Z. Tang, M. Lasi, L. Walters, L. Hall, and J.D. Miller. 2013. Expansion of harmful brown tides caused by the pelagophyte, Aureoumbra lagunensis DeYoe et Stockwell, to the US east coast. Harmful Algae 27:29–41.
Goodman, J.L., K.A. Moore, and W.C. Dennison. 1995. Photosynthetic responses of eelgrass (Zostera marina) to light and sediment sulfide in shallow barrier lagoon. Aquatic Botany 50:37–48.
Govers, L.L., J.H. de Brouwer, W. Suykerbuyk, T.J. Bouma, L.P. Lamers, A.J. Smolders, and M.M. van Katwijk. 2014. Toxic effects of increased sediment nutrient and organic matter loading on the seagrass Zostera noltii. Aquatic Toxicology 155:253–260.
Green, L., D.E. Gawlik, L. Calle, and B.E. Lapointe. 2015. Relative effects of physical and small-scale nutrient factors on the distribution of tropical seagrasses in the Great White Heron National Wildlife Refuge, Lower Florida Keys. Aquatic Botany 124:45–53.
Green, E.P., and F.T. Short. 2003. World Atlas of Seagrasses. Prepared by the UIMEP World Conservation
Monitoring Centre. University of California Press, Berkeley, USA.
Greening, H., and A. Janicki. 2006. Toward reversal of eutrophic conditions in a subtropical estuary: Water quality and seagrass response to nitrogen loading reductions in Tampa Bay, Florida, USA. Environmental Management 38(2):163–178.
Greening, H., A. Janicki, E.T. Sherwood, R. Pribble, and J.O.R. Johansson. 2014. Ecosystem responses to long-term nutrient management in an urban estuary: Tampa Bay, Florida, USA. Estuarine, Coastal and Shelf Science 151:A1–A16.
Greve, T.M., and D. Krause-Jensen. 2005. Predictive modelling of eelgrass (Zostera marina) depth limits. Marine Biology 146:849–858.
Gurbisz, C., W.M. Kemp, L.P. Sanford, and R.J. Orth. 2016. Mechanisms of storm-related loss and resilience in a large submersed plant bed. Estuaries and Coasts 39(4):951–966.
Hagy, J.D., J.C. Kurtz, and R.M. Greene. 2008. An Approach for Developing Numeric Nutrient Criteria for a Gulf Coast Estuary. EPA 600R-08/004. U.S. Environmental Protection Agency, Office of Research and Development, National Health and Environmental Effects Laboratory, Research Triangle Park, North Carolina.
Han, Q., L.M. Soissons, T.J. Bouma, M.M. van Katwijk, and D. Liu. 2016. Combined nutrient and macroalgae loads lead to response in seagrass indicator properties. Marine Pollution Bulletin 106:174–182.
Han, Q., L.M. Soissons, D. Liu, M.M. van Katwijk, and T.J. Bouma. 2017. Individual and population indicators of Zostera japonica respond quickly to experimental addition of sediment-nutrient and organic matter. Marine Pollution Bulletin 114:201–209.
Hauxwell, J., J. Cebrian, C. Furlong, and I. Valiela. 2001. Macroalgal canopies contribute to eelgrass (Zostera marina) decline in temperate estuarine ecosystems. Marine Ecology Progress Series 82(4):1007–1022.
Hauxwell, J., J. Cebrian, and I. Valiela. 2003. Eelgrass Zostera marina loss in temperate estuaries: relationship to land-derived nitrogen loads and effect of light limitation imposed by algae. Marine Ecology Progress Series 247:59–73.
Heck, K.L., J.R. Pennock, J.F. Valentine, L.D. Coen, and S.A. Sklenar. 2000. Effects of nutrient enrichment and small predator density on seagrass ecosystems: an experimental assessment. Limnology and Oceanography 45(5):1041–1057.
Hendriks, I.E., Y.S. Olsen, and C.M. Duarte. 2017. Light availability and temperature, not increased CO2, will structure future meadows of Posidonia oceanica. Aquatic Botany 139:32–36.
Hemminga, M.A., and C.M. Duarte. 2000. Seagrass Ecology. Cambridge University Press, Cambridge, UK.
Hessing-Lewis, M.L., S.D. Hacker, B. Menge, and S.S. Rumrill. 2011. Context-dependent eelgrass–macroalgae interactions along an estuarine gradient in the Pacific Northwest, USA. Estuaries and Coasts 34(6):1169–1181.
Hirst, A.J., and G.P. Jenkins. 2017. Experimental test of N-limitation for Zostera nigricaulis seagrass at three sites reliant upon very different sources of N. Journal of Experimental Marine Biology and Ecology 486:204–213.
Holmquist, J.G. 1997. Disturbance and gap formation in a marine benthic mosaic: influence of shifting macroagal patches on seagrass structure and mobile invertebrates. Marine Ecology Progress Series 158:121–130.
Honig, S.E., B. Mahoney, J.S. Glanz, and B.B. Hughes. 2017. Are seagrass beds indicators of anthropogenic nutrient stress in the rocky intertidal? Marine Pollution Bulletin 114:539–546.
Hughes, A.R., S.L. Williams, C.M. Duarte, K.L. Heck Jr., and M. Waycott. 2009. Associations of concern: seagrasses and threatened dependent species. Frontiers in Ecology and the Environment 7(5):242–246.
Jackson, J. 2001. What was natural in the coastal oceans. Proceedings of the National Academy of Sciences 98(10):5411–5418.
Janicki, A., and D. Wade. 1996. Estimating critical external nitrogen loads for the Tampa Bay Estuary: An empirically based approach to setting management targets. Prepared for: Tampa Bay National Estuary Program. Technical Publication #06–96.
Janicki, A., D.L. Wade, and D.E. Robison. 1995. Habitat protection and restoration targets for Tampa Bay. Prepared for: Tampa Bay Estuary Program. Technical Publication #07–93.
Janicki, A., R. Pribble, and S. Janicki. 2001. Tampa Bay Estuary Program Model Evaluation and Update: Nitrogen Load – Chlorophyll a Relationship. Prepared for: Tampa Bay National Estuary Program.
Jiménez-Ramos, R., M. Mancilla, B. Villazán, L.G. Egea, V. González-Ortiz, J.J. Vergara, J.L. Pérez-Lloréns, and F.G. Brun. 2017. Resistance to nutrient enrichment varies among components in the Cymodocea nodosa community. Journal of Experimental Marine Biology and Ecology 497:41–49.
Jones, B.L., and R.K. Unsworth. 2016. The perilous state of seagrass in the British Isles. Royal Society Open Science 3:150–596.
Kaldy, J.E. 2006. Production ecology of the non-indigenous seagrass, Dwarf Eelgrass (Zostera japonica Ascher. & Graeb.), in a Pacific Northwest estuary, USA. Hydrobiologia 553(1):201–217.
Kaldy, J.E. 2014. Effect of temperature and nutrient manipulations on eelgrass Zostera marina L. from the Pacific Northwest, USA. Journal of Experimental Marine Biology and Ecology 453:108–115.
Kaldy, J.E., C.A. Brown, W.G. Nelson, and M. Frazier. 2017. Macrophyte community response to nitrogen loading and thermal stressors in rapidly flushed mesocosm systems. Journal of Experimental Marine Biology and Ecology 497:107–119.
Kaldy, J.E., D.J. Shafer, and A.D. Magoun. 2015. Duration of temperature exposure controls growth of Zostera japonica: Implications for zonation and colonization. Journal of Experimental Marine Biology and Ecology 464:68–74.
Kemp, W.M., R. Batiuk, R. Bartleson, P. Bergstrom, V. Carter, C.L. Gallegos, W. Hunley, L. Karrh, E.W. Koch, J.M. Landwehr, K.A. Moore, L. Murray, M. Naylor, N.B. Rybicki, J.C. Stevenson, and D.J. Wilcox. 2004. Habitat requirements for submerged aquatic vegetation in Chesapeake Bay: Water quality, light regime, and physical-chemical factors. Estuaries 27(3):363–377.
Kenworthy, W.J., and M.S. Fonseca. 1996. Light requirements of seagrasses Halodule wrightii and Syringodium filiforme derived from the relationship between diffuse light attenuation and maximum depth distribution. Estuaries 19(3):740–750.
Kenworthy, W.J., C.L. Gallegos, C. Costello, D. Field, and G. di Carlo. 2014. Dependence of eelgrass (Zostera marina) light requirements on sediment organic matter in Massachusetts coastal bays: Implications for remediation and restoration. Marine Pollution Bulletin 83:446–457.
Kim, Y.K., S.H. Kim and K.S. Lee. 2015. Seasonal growth responses of the seagrass Zostera marina under severely diminished light conditions. Estuaries and Coasts 38:558–568.
Koch, E.W. 2001. Beyond light: Physical, geological, and geochemical parameters as possible submersed aquatic vegetation habitat requirements. Estuaries 24(1):1-17.
Koch, M., G. Bowes, C. Ross, and X-H. Zhang. 2013. Climate change and ocean acidification effects on seagrasses and marine macroalgae. Global Change Biology 19(1):103–132.
Kohlmeier, D., C.A. Pilditch, J.F. Bornman, and K. Bischof. 2014. Site specific differences in morphometry and photophysiology in intertidal Zostera muelleri meadows. Aquatic Botany 116:104–109.
Krause-Jensen, D., M.F. Pedersen, and C. Jensen. 2003. Regulation of eelgrass (Zostera marina) cover along depth gradients in Danish coastal waters. Estuaries 26(4):866–877.
Krause-Jensen, D., S. Sagert, H. Schubert, and C. Boström. 2008. Empirical relationships linking distribution and abundance of marine vegetation to eutrophication. Ecological Indicators 8(5):515–529.
Landry, J.B., and R.R. Golden. 2018. In situ effects of shoreline type and watershed land use on submerged aquatic vegetation habitat quality in the Chesapeake and Mid-Atlantic Coastal Bays. Estuaries and Coasts 41(1):101–113.
Larkum, A.W., R.J. Orth, and C.M. Duarte. 2006. Seagrasses: Biology, Ecology and Conservation. Springer, The Netherlands.
Latimer, J.S., and S.A. Rego. 2010. Empirical relationship between eelgrass extent and predicted watershed-derived nitrogen loading for shallow New England estuaries. Estuarine, Coastal and Shelf Science 90:231–240.
Lee, K-S., S.R. Park, and Y.K. Kim. 2007. Effects of irradiance, temperature, and nutrients on growth dynamics of seagrasses: A review. Journal of Experimental Marine Biology and Ecology 350:144–175.
Lefcheck, J.S., D.J. Wilcox, R.R. Murphy, S.R. Marion, and R.J. Orth. 2017. Multiple stressors threaten the imperiled coastal foundation species eelgrass (Zostera marina) in Chesapeake Bay, USA. Global Change Biology 23:3474–3483.
Lirman, D., T. Thyberg, R. Santos, S. Schopmeyer, C. Drury, L. Collado-Vides, S. Bellmund, and J. Serafy. 2014. SAV communities of western Biscayne Bay, Miami, Florida, USA: Human and natural drivers of seagrass and macroalgae abundance and distribution along a continuous shoreline. Estuaries and Coasts 37(5):1243–1255.
Livingston, R.J., S.E. McGlynn, and X.F. Niu. 1998. Factors controlling seagrass growth in a gulf coastal system: Water and sediment quality and light. Aquatic Botany 60:135–159.
Lopez, C.B., Q. Dortch, E.B. Jewett, and D. Garrison. 2008. Scientific Assessment of Marine Harmful Algal Blooms. Interagency Working Group on Harmful Algal Blooms, Hypoxia, and Human Health of the Joint Subcommittee on Ocean Science and Technology, Washington, D.C.
Lyons, J., J. Ahern, J. McClelland, and I. Valiela. 1995. Macrophyte abundances in Waquoit Bay estuaries subject to different nutrient loads and the potential role of fringing salt-marsh in groundwater nitrogen interception. Biology Bulletin 189:255–256.
Malyshev, A., and P.A. Quijon. 2011. Disruption of essential habitat by a coastal invader: new evidence of the effects of green crabs on eelgrass beds. ICES Journal of Marine Science 68(9):1852–1856.
Martínez-Crego, B., I. Olivé, and R. Santos. 2014. CO2 and nutrient-driven changes across multiple levels of organization in Zostera noltii ecosystems. Biogeosciences 11:7237–7249.
McGlathery, K.J., K. Sundbäck, and I.C. Anderson. 2007. Eutrophication in shallow coastal bays and lagoons: the role of plants in the coastal filter. Marine Ecology Progress Series 348:1–18.
McLaughlin, K., and M. Sutula. 2007. Developing Nutrient Numeric Endpoints and TMDL Tools for California Estuaries: An Implementation Plan. Technical Report 540. Prepared for USEPA Region IX and California State Wtaer Resources Control Board, Planning and Standards Implementation Unit, by Tetra Tech, Lafayette, CA, and Southern California Coastal Water Research Project, Costa Mesa, CA.
MEP (Massachusetts Estuary Project). 2019. The Massachusetts Estuaries Project and Reports Guide. https://www.mass.gov/guides/the-massachusetts-estuaries-project-and-reports Exit.
Moore, K.A., E.C. Shields, and D.B. Parrish. 2014. Impacts of varying estuarine temperature and light conditions on Zostera marina (Eelgrass) and its interactions with Ruppia maritima (Widgeongrass). Estuaries and Coasts 37(Suppl 1):S20–S30.
Moreno-Marín, F., J.J. Vergara, J.L. Pérez-Llorens, M.F. Pedersen, and F.G. Brun. 2015. Interaction between ammonium toxicity and green tide development over seagrass meadows: A laboratory study. PLOS ONE 11(4):e0152971.
Muehlstein, L.K. 1989. Perspectives on the wasting disease of eelgrass Zostera marina. Diseases of Aquatic Organisms 7:211–221.
Mutchler, T., and D.K. Hoffman. 2017. Response of seagrass (Thalassia testudinum) metrics to short-term nutrient enrichment and grazing manipulations. Journal of Experimental Marine Biology and Ecology 486:105–113.
Neckles, H.A. 2015. Loss of eelgrass in Casco Bay, Maine, linked to green crab disturbance. Northeastern Naturalist 22(3):478–500.
Nelson, W.G. (ed.). 2009. Seagrasses and Protective Criteria: A Review and Assessment of Research Status. EPA/600/R-09/050. U.S. Environmental Protection Agency, Office of Research and Development, National Health and Environmental Effects Research Laboratory.
Nelson, W.G. 2017a. Development of an epiphyte indicator of nutrient enrichment: A critical evaluation of observational and experimental studies. Ecological Indicators 79:207–227.
Nelson, W.G. 2017b. Development of an epiphyte indicator of nutrient enrichment: Threshold values for seagrass epiphyte load. Ecological Indicators 74:343–356.
Nelson, W.G. 2018. An evaluation of factors controlling the abundance of epiphytes on Zostera marina along an estuarine gradient in Yaquina Bay, Oregon, USA. Aquatic Botany 148:53–63.
Nielsen, S.L., K. Sand-Jensen, J. Borum, and O. Geertz-Hansen. 2002. Depth colonization of eelgrass (Zostera marina) and macroalgae as determined by water transparency in Danish coastal waters. Estuaries 25(5):1025–1032.
Nixon, S.W., B. Buckley, S. Granger, and J. Bintz. 2001. Responses of very shallow marine ecosystems to nutrient enrichment. Human and Ecology Risk Assessment 7:1457–1481.
Nordlund, L.M., E.W. Koch, E.B. Barbier, and J.C. Creed. 2016. Seagrass ecosystem services and their variability across genera and geographical regions. PLOS ONE 11(10):e0163091.
Norris, J.G., S. Wyllie-Echeverria, T. Mumford, A. Bailey, and T. Turner. 1997. Estimating basal area coverage of subtidal seagrass beds using underwater videography. Aquatic Botany 58:269–287.
Olesen, B. 1996. Regulation of light attenuation and eelgrass Zostera marina depth distribution in a Danish embayment. Marine Ecology Progress Series 134:187–194.
Orth, R.J., T.J.B. Carruthers, W.C. Dennison, C.M. Duarte, J.W. Fourqurean, K.L. Heck Jr., A.R. Hughes, G.A. Kendrick, W.J. Kenworthy, S. Olyarnik, F.T. Short, M. Waycott, and S.L. Williams. 2006. A global crisis for seagrass ecosystems. BioScience 56(12):987–996.
Oscar, M.A., S. Barak, and G. Winters. 2018. The tropical invasive seagrass, Halophila stipulacea, has a superior ability to tolerate dynamic changes in salinity levels compared to its freshwater relative, Vallisneria Americana. Frontiers in Plant Science 9(950):1–19.
Östman, Ö., J. Eklöf, B.K. Eriksson, J. Olsson, P.O. Moksnes, and U. Bergström. 2016. Top‐down control as important as nutrient enrichment for eutrophication effects in North Atlantic coastal ecosystems. Journal of Applied Ecology 53:1138–1147.
Ow, Y.X., S. Uthicke, and C.J. Collier. 2016. Light levels affect carbon utilisation in tropical seagrass under ocean acidification. PLOS ONE 11(3):e0150352.
Patrick, C.J., D.E. Weller, X. Li, and M. Ryder. 2014. Effects of shoreline alteration and other stressors on submerged aquatic vegetation in subestuaries of Chesapeake Bay and the mid-Atlantic coastal bays. Estuaries and Coasts 37:1516–1531.
Patrick, C.J., D.E. Weller, and M. Ryder. 2016. The relationship between shoreline armoring and adjacent submerged aquatic vegetation in Chesapeake Bay and nearby Atlantic coastal bays. Estuaries and Coasts 39:158–170.
Pedersen, O., T. Binzer, and J. Borum. 2004. Sulphide intrusion in eelgrass (Zostera marina L.). Plant, Cell and Environment 27:595–602.
Pedersen, O., T.D. Colmer, J. Borum, A. Zavala‐Perez, and G.A. Kendrick. 2016. Heat stress of two tropical seagrass species during low tides–impact on underwater net photosynthesis, dark respiration and diel in situ internal aeration. New Phytologist 210:1207–1218.
Pergent, G., C. Pergent-Martini, A. Bein, M. Dedeken, P. Oberti, A. Orsini, J.F. Santucci, and F. Short. 2015. Dynamic of Posidonia oceanica seagrass meadows in the northwestern Mediterranean: Could climate change be to blame? Comptes Rendus Biologies 338:484–493.
Phlips, E.J., S. Badylak. M.A. Lasi, R. Chamberlain, W.C. Green, L.M. Hall, J.A. Hart, J.C. Lockwood, J.D. Miller, L.J. Morris, and J.S. Steward. 2015. From red tides to green and brown tides: bloom dynamics in a restricted subtropical lagoon under shifting climatic conditions. Estuaries and Coasts 38:886–904.
Potouroglou, M., E.J. Kenyon, A. Gall, K.J. Cook, and J.C. Bull. 2014. The roles of flowering, overwinter survival and sea surface temperature in the long-term population dynamics of Zostera marina around the Isles of Scilly, UK. Marine Pollution Bulletin 83:500–507.
Pregnall, A.M., R.D. Smith, T.A. Kursar, and R.S. Alberte. 1984. Metabolic adaptation of Zostera marina (eelgrass) to diurnal periods of root anoxia. Marine Biology 83:141–147.
Prosser, D.J., T.E. Jordan, J.L. Nagel, R.D. Seitz, D.E. Weller, D.F. Whigham. 2018. Impacts of coastal land use and shoreline armoring on estuarine ecosystems: An introduction to a special issue. Estuaries and Coasts 41(1):S2–S18.
Pulich Jr., W., C. Blair, and W.A. White. 1997. Current Status and Historical Trends of Seagrasses in the Corpus Christi Bay National Estuary Program Study Area. Technical Report CCBNEP-20. Texas Natural Resource Conservation Commission, Austin, Texas.
Ralph, P.J., M.J. Durako, S. Enríquez, C.J. Collier, and M.A. Doblin. 2007. Impact of light limitation on seagrasses. Journal of Experimental Marine Biology and Ecology 350:176–193.
Rasheed, M.A., S.A. McKenna, A.B. Carter, and R.G. Coles. 2014. Contrasting recovery of shallow and deep water seagrass communities following climate associated losses in tropical north Queensland, Australia. Marine Pollution Bulletin 83:491–499.
Reynolds, P.L., J.P. Richardson, and J.E. Duffy. 2014. Field experimental evidence that grazers mediate transition between microalgal and seagrass dominance. Limnology and Oceanography 59(3):1053–1064.
Rivers, D.O., and F.T. Short. 2007. Effect of grazing by Canada geese Branta canadensis on an intertidal eelgrass Zostera marina meadow. Marine Ecology Progress Series 333:271–279.
Ruesink, J.L. 2016. Epiphyte load and seagrass performance are decoupled in an estuary with low eutrophication risk. Journal of Experimental Marine Biology and Ecology 481:1–8.
Rudnick, D.T., P.B. Ortner, J.A. Browder, and S.M. Davis. 2005. A conceptual ecological model of Florida Bay. Wetlands 25(4):870–883.
Sagert, S., D. Krause Jensen, P. Henriksen, T. Rieling, and H. Schubert. 2005. Integrated ecological assessment of Danish Baltic Sea coastal areas by means of phytoplankton and macrophytobenthos. Estuary Coastal Shelf Science 63:109–118.
Sakanishi, Y., and T. Komatsu. 2017. Growing depth limit of Zostera caulescens in coastal waters along the Japan Sea coast of Honshu, Japan. Fisheries Science 83:977–986.
Salo, T., and M.F. Pedersen. 2014. Synergistic effects of altered salinity and temperature on estuarine eelgrass (Zostera marina) seedlings and clonal shoots. Journal of Experimental Marine Biology and Ecology 457:143–150.
Salo, T., M.F. Pedersen, and C. Boström. 2014. Population specific salinity tolerance in eelgrass (Zostera marina). Journal of Experimental Marine Biology and Ecology 461:425–429.
Shafer, D.J., J.E. Kaldy, and J.L. Gaeckle. 2014. Science and management of the introduced seagrass Zostera japonica in North America. Environmental Management 53:147–162.
Short, F.T., L.K. Muehlstein, and D. Porter. 1987. Eelgrass wasting disease: cause and recurrence of a marine epidemic. Biological Bulletin 173:557–562.
Short, F.T., and D.M. Burdick. 1996. Quantifying eelgrass habitat loss in relation to housing development and nitrogen loading in Waquoit Bay, Massachusetts. Estuaries 19(3):730–739.
Short, F.T., and S. Wyllie-Echeverria. 1996. Natural and human induced disturbances of seagrasses. Environmental Conservation 23:17–27.
Silva-Santos, P., M.A. Pardal, R.J. Lopez, T. Murias, and A. Cabral. 2006. A stochastic dynamic methodology (SDM) to the modelling of trophic interactions, with a focus on estuarine eutrophication scenarios. Ecology Indicators 6:394–408.
Smith, R.D., A.M. Pregnall, and R.S. Alberte. 1988. Effects of anaerobiosis on root metabolism of Zostera marina (eelgrass): Implications for survival in reducing sediments. Marine Biology 98:130–141.
Soissons, L.M., M.M. Van Katwijk, G. Peralta, F.G. Brun, P.G. Cardoso, T.F. Grilo, B. Ondiviela, M. Recio, M. Valle, J. M. Garmendia, F. Ganthy, I. Auby, L. Rigouin, L. Godet, J. Fournier, N. Desroy, L. Barille, P. Kadel, R. Asmus, P.M.J. Herman, and T.J. Bouma. 2018. Seasonal and latitudinal variation in seagrass mechanical traits across Europe: The influence of local nutrient status and morphometric plasticity. Limnology & Oceanography 63:37–46.
Statton, J., K. McMahon, P. Lavery, and G.A. Kendrick. 2018. Determining light stress responses for a tropical multi-species seagrass assemblage. Marine Pollution Bulletin 128:508–518.
Steward, J.S., R.F. Virnstein, L.J. Morris, and E.F. Lowe. 2005. Setting seagrass depth, coverage, and light targets for the Indian River Lagoon System, Florida. Estuaries 28(6):923–935.
Stoner, E.W., L.A. Yeager, J.L. Sweatman, S.S. Sebilian, and C.A. Layman. 2014. Modification of a seagrass community by benthic jellyfish blooms and nutrient enrichment. Journal of Experimental Marine Biology and Ecology 461:185–192.
Strydom, S., L.M. McMahon, G.A. Kendrick, J. Statton, and P.S. Lavery. 2018. Short-term responses of Posidonia australis to changes in light quality. Frontiers in Plant Science 8:1–13.
Sullivan, B.K., T.D. Sherman, V.S. Damare, O. Lilje, and F.H. Gleason. 2013. Potential roles of Labyrinthula spp. in global seagrass population declines. Fungal Ecology 6(5):328–338.
Sutula M., P. Fong, J. Kaldy, K. McLaughlin, D. Gillett, M. Howard, C. Madden, L. Green, R. Kennison, J.A. Ranasinghe and N. Beck. 2011. Review of Indicators for Development of Nutrient Numeric Endpoints in California Estuaries. Southern California Coastal Water Research Project Technical Report No. 646.
Sutula, M., and D. Senn. 2015. Scientific basis for assessment of nutrient impacts on San Francisco Bay. Technical Report 864. Southern California Coastal Water Research Project, Costa Mesa, California.
Tango, P.J., and R.A. Batiuk. 2013. Deriving Chesapeake Bay water quality standards. Journal of
the American Water Resources Association 49(5):1007–1024.
Terrados, J., C.M. Duarte, M.D. Fortes, J. Borum, N.S.R. Agawin, and S. Bach. 1998. Changes in community structure and biomass of seagrass communities along gradients of siltation in SE Asia. Estuary Coastal Shelf Science 46:757–768.
Thom, R.M., A.B. Borde, S. Rumrill, D.L. Woodruff, G.D. Williams, J.A. Southard, and S.L. Sargeant. 2003. Factors influencing spatial and annual variability in eelgrass (Zostera marina L.) meadows in Willapa Bay, Washington, and Coos Bay, Oregon, estuaries. Estuaries 26(4B):1117–1129.
Thomsen, M.S., T. Wernberg, A.H. Engelen, F. Tuya, M.A. Vanderklift, M. Holmer, K.J. McGlathery, F. Arenas, J. Kotta, and B.R. Silliman. 2012. A meta-analysis of seaweed impacts on seagrasses: Generalities and knowledge gaps. PLOS ONE 7(1):e28595.
Tomasko, D.A., C.J. Dawes, and M.O. Hall. 1996. The effects of anthropogenic nutrient enrichment on turtle grass (Thalassia testudinum) in Sarasota Bay, Florida. Estuaries 19(2B):448–456.
Tomasko, D.A., and M.O. Hall. 1999. Productivity and biomass of the seagrass Thalassia testudinum along a gradient of freshwater influence in Charlotte Harbor, Florida. Estuaries 22(3A):592–602.
USEPA (U.S. Environmental Protection Agency). 1998. Guidelines for Ecological Risk Assessment. EPA/630/R-95/002F. U.S. Environmental Protection Agency, Washington, DC.
USEPA (U.S. Environmental Protection Agency). 2001. Nutrient Criteria Technical Guidance Manual – Estuarine and Coastal Marine Waters. EPA-822-B-01-003. U.S. Environmental Protection Agency, Washington, DC.
Vacchi, M., G. De Falco, S. Simeone, M. Montefalcone, C. Morri, M. Ferrari, and C.N. Bianchi. 2016. Biogeomorphology of the Mediterranean Posidonia oceanica seagrass meadows. Earth Surface Processes and Landforms 42:42–54.
Vacchi, M., M. Montefalcone, C.F. Schiaffino, V. Parravicini, C.N. Bianchi, C. Morri, and M. Ferrari. 2014. Towards a predictive model to assess the natural position of the Posidonia oceanica seagrass meadows upper limit. Marine Pollution Bulletin 83:458–466.
Valentine, J.F., and J.E. Duffy. 2006. The central role of grazing in seagrass ecology. In Seagrasses: Biology, Ecology, and Conservation, eds. A.W.D. Larkum, R.J. Orth, C.M. Duarte, pp. 463-501. Springer, The Netherlands.
Valiela, I., J. McClelland, J. Hauxwell, P.J. Behr, D. Hersh, and K. Foreman. 1997. Macroalgal blooms in shallow estuaries: Controls and ecophysiological and ecosystem consequences. Limnology and Oceanography 42(5, part 2):1105–1118.
van Katwijk, M.M., L.H.T. Vergeer, G.H.W. Schmitz, and J.G.M. Roelofs. 1997. Ammonium toxicity in eelgrass Zostera marina. Marine Ecology Progress Series 157:159–173.
van Wijck, C., C.J. de Groot, and P. Grillas. 1992. The effect of anaerobic sediment on the growth of Potamogeton pectinatus L.: The role of organic matter, sulphide and ferrous iron. Aquatic Botany 44:31–49.
Vaudrey, J.M.P., J. Eddings, C. Pickerell, L. Brousseau, and C. Yarish. 2013. Development and application of a GIS-based Long Island Sound Eelgrass Habitat Suitability Index Model. Final report submitted to the New England Interstate Water Pollution Control Commission and the Long Island Sound Study.
Vicente, V.P., and J.A. Rivera. 1982. Depth limits of the seagrass Thalassia testudinum (Konig) in Jobos and Guayanilla bays, Puerto Rico. Caribbean Journal of Science 17:73–79.
Virnstein, R.W., J.S. Steward, and L.J. Morris. 2007. Seagrass coverage trends in the Indian River Lagoon system. Florida Scientist 70:397–404.
Wazniak, C.E., M.R. Hall, T.J.B. Carruthers, B. Sturgis, W.C. Dennison, and R.J. Orth. 2007. Linking water quality to living resources in a mid-Atlantic lagoon system, USA. Ecological Applications 17(5):S64–S78.
Willette, D.A. and R.F. Ambrose. 2012. Effects of the invasive seagrass Halophila stipulacea on the native seagrass, Syringodium filiforme, and associated fish and epibiota communities in the Eastern Caribbean. Aquatic Botany 103:74–82.
Willette, D.A., J. Chalifour, A.O.D. Debrot, M.S. Engel, J. Miller, H.A. Oxenford, F.T. Short, S.C.C. Steiner, and F. Védie. 2014. Continued expansion of the trans-Atlantic invasive marine angiosperm Halophila stipulacea in the Eastern Caribbean. Aquatic Botany 112:98–102.
Williams, S.L. 2007. Introduced species in seagrass ecosystems: Status and concerns. Journal of Experimental Marine Biology and Ecology 350:89–110.
Wong, M.C. and B. Vercaemer. 2012. Effects of invasive colonial tunicates and a native sponge on the growth, survival, and light attenuation of eelgrass (Zostera marina). Aquatic Invasions 7(3):315–326.
Yaakub, S.M., E. Chen, T.J. Bouma, P.L. Erftemeijer, and P.A. Todd. 2014. Chronic light reduction reduces overall resilience to additional shading stress in the seagrass Halophila ovalis. Marine Pollution Bulletin 83:467–474.
Yang, X., P. Zhang, W. Li, C. Hu, X. Zhang, and P. He. 2018. Evaluation of four seagrass species as early warning indicators for nitrogen overloading: Implications for eutrophic evaluation and ecosystem management. Science of the Total Environment 635:1132–1143.
Young, C.S., B.J. Peterson, and C.J. Gobler. 2017. The bloom-forming macroalgae, Ulva, outcompetes the seagrass, Zostera marina, under high CO2 conditions. Estuaries and Coasts 41(8):2340–2355.
Young, D.R. 2009. Macroalgal interactions with the seagrasses Zostera spp. and Thalassia testudinum. In Seagrasses and Protective Criteria: A Review and Assessment of Research Status, Ch. 8. EPA/600/R-09/050. e.d. W.G. Nelson. Office of Research and Development, National Health and Environmental Effects Research Laboratory.
Zhang, J., X. Huang, and Z. Jiang. 2014. Physiological responses of the seagrass Thalassia hemprichii (Ehrenb.) Aschers as indicators of nutrient loading. Marine Pollution Bulletin 83:508–515.
Zieman, J.C. 1982. The ecology of seagrasses of South Florida: a community profile. FWS/OBS-82/25. U.S. Fish and Wildlife Services, Office of Biological Services, Washington, D.C.
Zimmerman, R.C., A. Cabello-Pasini, and R.S. Alberte. 1994. Modeling daily production of aquatic macrophytes from irradiance measurements: A comparative analysis. Marine Ecology Progress Series 114:185–196.
Zimmerman, R.C., J.L. Reguzzoni, and R.S. Alberte. 1995. Eelgrass (Zostera marina L.) transplants in San Francisco Bay: Role of light availability on metabolism, growth and survival. Aquatic Botany 51:67–86.